Mar 24•9 min read
Normality? It's Been Nice Knowing You
You may not be interested in normality, but normality is interested in you.
After the extraordinary measures taken during the pandemic, we can expect normality to be resumed sometime this year. But which normality? The normality which prevailed before the Crisis of Western Financial Institutions in 2007/08, or the weird and anomalous 'normality' practiced and experienced since then? Or something even stranger?
The problem is that even the most cautious interpretation of 'normality' tells us that US bond yields are still not even close to where we should expect them to move in the short to medium term. Even on quite cautious accounting and expectations, the proper range for US treasuries in 2021 starts at around 3%. If growth lets rip, if inflation actually breaks out, the range climbs higher.
What sort of normality we end up with will largely depend on what happens in the US bond markets. So a little history is in order.
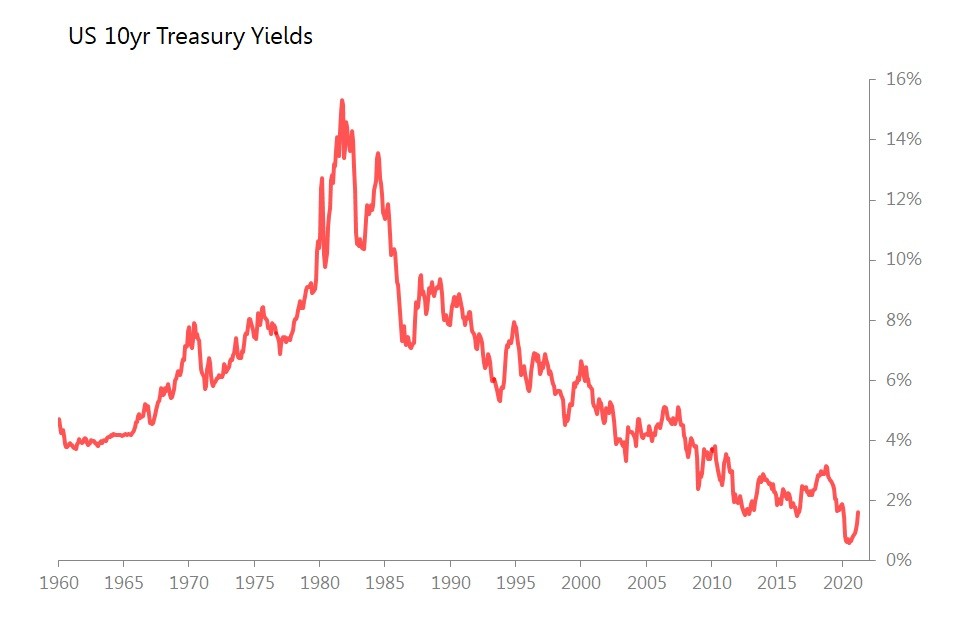
I suspect that 20yr bond bull market was exhausted by around 2003, having in the recent past produced three major signals that the party was over: i) the Asian financial crises in 1997/98; ii) LTCM collapse in late 1998. and iii) the Russian financial crisis, also of 1998. In all these cases, the crisis was ultimately caused by investors taking on more risk as they sought to compensate for the end of the bond bull market they had growth up with.
There were two reactions. The first, by policymakers, was to double down, cutting short term rates further to push bond yields yet lower. The second, by institutional investors and people who should have known better, was to keep seeking yield by buying riskier bonds (and other assets) but protecting themselves by buying credit default swaps. When push came to shove (initially via a failing Italian dairy company) it was discovered that, actually, CDSs didn't offer the protection they were advertised as providing.
But what the hell? Between 2001 and 2007, the notional value of CDSs outstanding had a compound annual growth rate of 102% pa. By the end of 2007, that meant there were a CDSs of a notional value of US$62.2 trillion written, almost all of which were held within the financial system, and most within a tightly defined clutch of major institutions.
Which is why the global financial system collapsed in 2007/2008. (Nb, naming it the Global Financial Crisis disguises its true nature: it should more accurately by called the Collapse of Western Financial Institutions.)
The rescue of the Western Financial Institutions by forms the background to the strange 'normality' which we have lived in since. It was/is characterized by very low or negative interest rates coupled with seemingly endless and value-less 'quantitative' and increasingly 'qualitative' easing. 'Quantitative easing' pretends to keep respecting the markets role of discovering the spectrum of credit prices for different time preferences and risk profiles, even as lowers the entire interest-rate structure abnormally. 'Qualitative easing' drops that pretense, with central banks buying any and all manner of financial assets they fancy - ETFs, REITs, corporate bonds, dodgy 'sovereign bonds', whilst commercial banks act as mere figleaves for direct credit policies financed by the central bank.
At its limit - for example in Japan - quantitative and qualitative easing has allowed the central bank to become the dominant, or even near-monopoly savings/credit allocator for the economy. This might be called 'capitalism with socialist characteristics.'
This is the historic context for the next chart, which compares 10yr US yields with GDP growth. There is a plain before/after split in this relationship between 1980-c2003 and the period after to the present day. In 1980-2003 'normality' 10yr bonds showed a fluctuating but positive yield above nominal growth rate; in the later period, yields have been persistently solidly below nominal growth rates, except in times of severe recession.
Between 1980 - 2003, 10 year yields were, on average, 1.6 percentage points above nominal GDP growth, with a standard deviation of 2.1 percentage points. The median was 1.1 percentage points above nominal GDP growth.
Since 2004, 10 year yields have been, on average 71 basis points below nominal GDP growth, with a standard deviation of 2.4%. The median was 1.4 percentage points below nominal GDP growth.
In other words, the current 10yr yield of 1.62% implies nominal GDP growth of around zero (on 1980-2003 'normality') or nominal GDP growth of around 2.3% (post-2004 'normality).
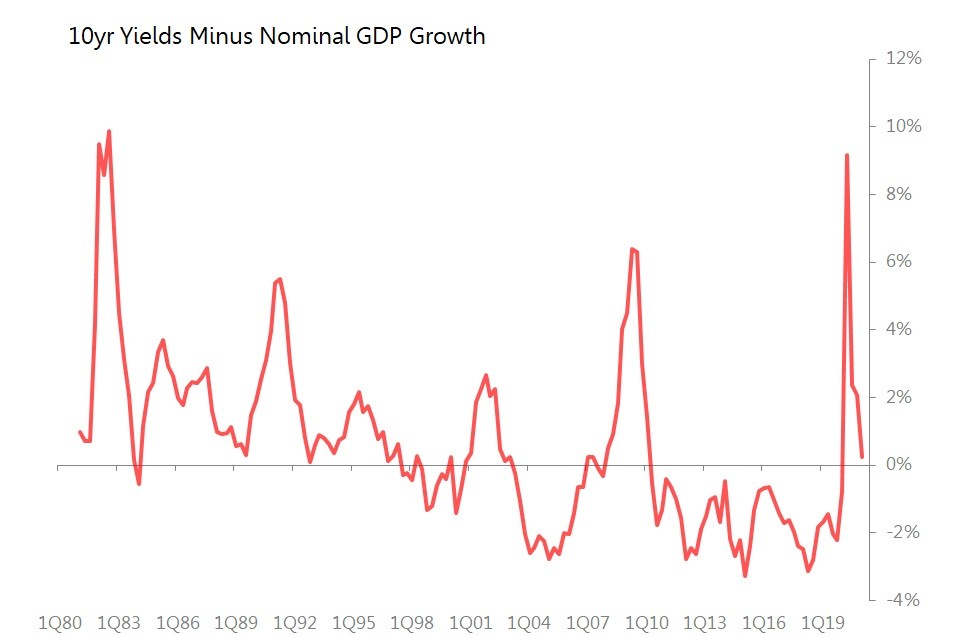
Who believes that nominal GDP growth is going to re-stabilize at between zero and 2.3%?
Normality: Growth, Inflation, TIPS and Risk Premia
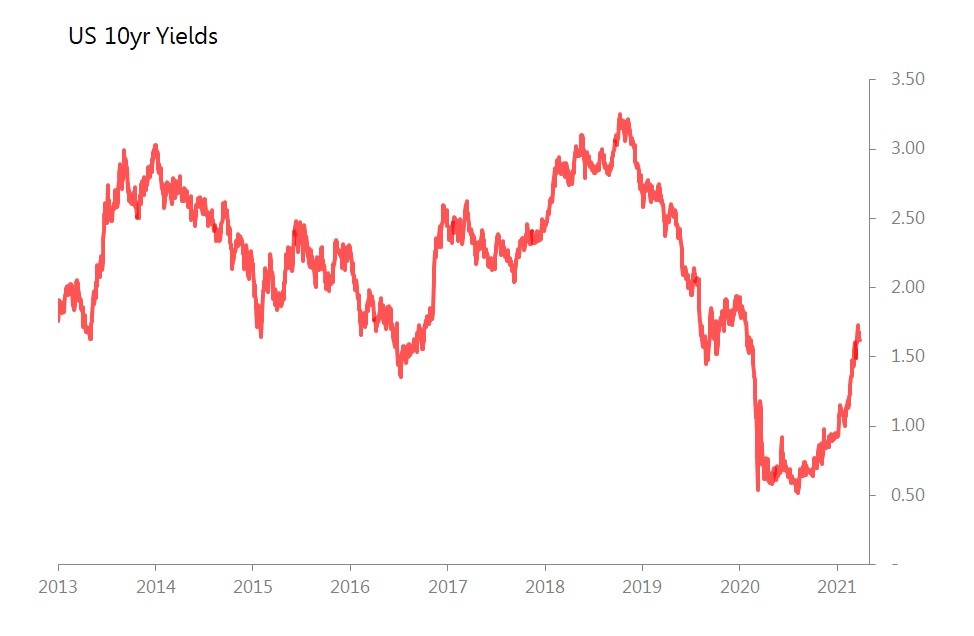
Now consider the message being broadcast by the US bond market currently. Since the end of September last year, yields have risen approximately a percentage point from a low of around 65bps to around 1.62%. Around these levels it is possible to believe, from a simple glance at the charts, that the rise in yields has already approached a pre-pandemic 'normality'.
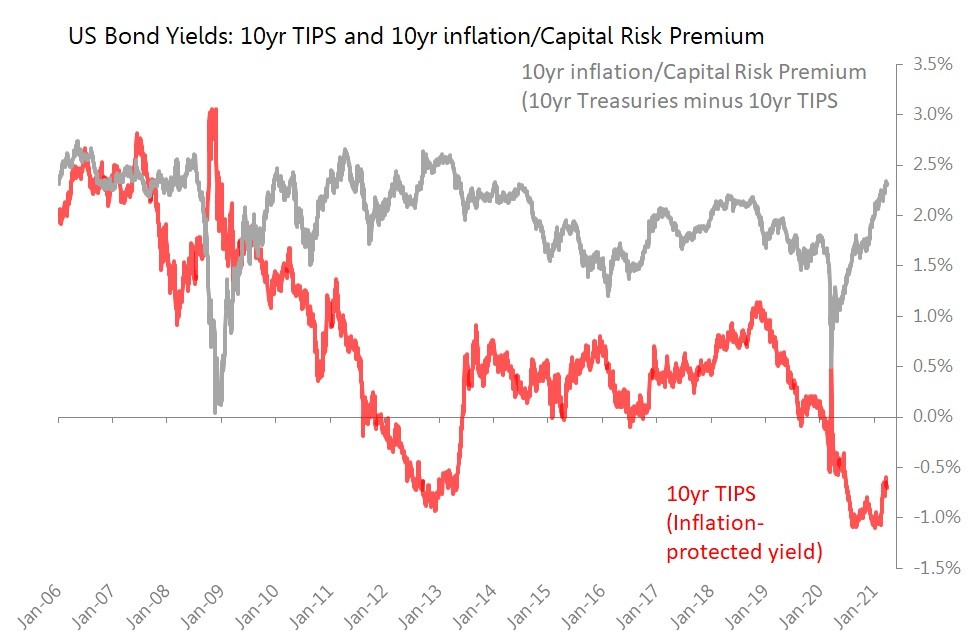
But that perception that 'normality' has been restored vanishes when we look at what has driven that rise in yields. We split the yield into two parts: i) the 10yr 'inflation-protected' TIPS yield, and ii) the capital risk (inflation risk) premium above that TIPS yield. Whilst the capital/inflation risk premium has indeed recovered back to 'normal' levels at 2.3% currently, the TIPS yield - the 'real yield' - remains in the negative territory it has occupied since the onset of the pandemic in February last year. Currently the 10yr TIPS is yielding minus 70bps. That is far from normal. Between 2013 and the onset of the pandemic, TIPS yields averaged 46bps, with a standard deviation of 25bps. Resumption of normality would involve a rise of 1.15pps in TIPS yields (with upper and lower limits 25bps either side).
With TIPS yielding 46bps and the capital risk premium unchanged at 2.3%, a return to pre-pandemic 'normality' would lift 10yr yields to around 2.75%.
This, however, is not the end of the story, for we also have to take into account the current prospects both for GDP growth (to get an idea of likely TIPS yields) and for inflation (to get an idea of the necessary inflation/capital risk premium likely required).
Warning: this is going to get uncomfortable, for the short-term prospects suggest that even mere 'normality' will bring a sharp rise in bond yields.
The Problem for TIPS Yields. The problem for TIPS is that their current level of minus 0.89% is absolutely incompatible with the expectation of a resumption of normal growth, and far less with the sort of GDP rebound expected this year. In what follows I treat GDP expectations as being generated simply by the experience of the previous five years. The chart below tracks quarterly average TIPS yields minus 5yr GDP growth averages.
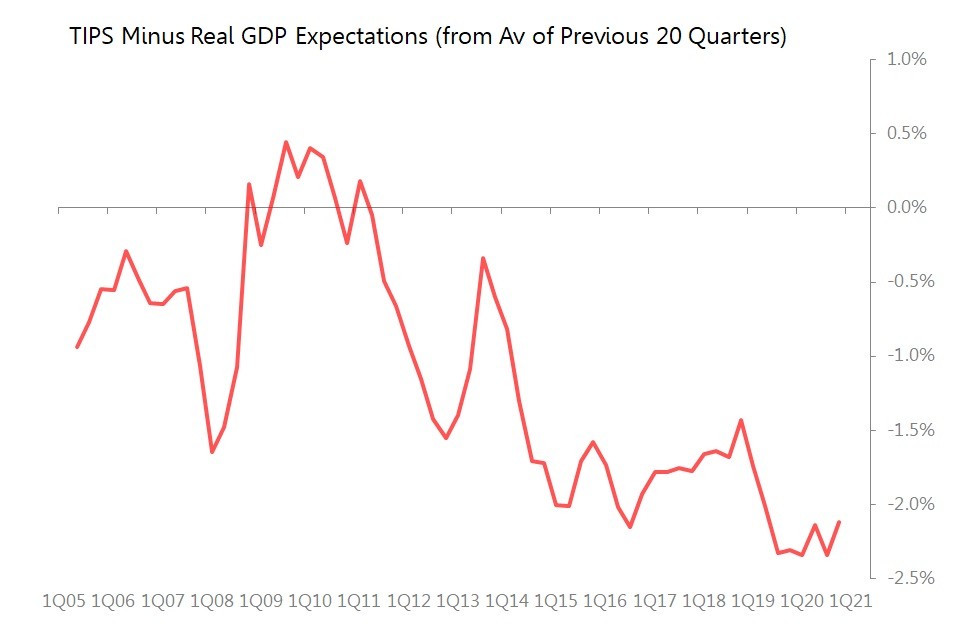
It shows that during 2020's pandemic, TIPS yields sank to around 2.3% below 5yr GDP averages - a new low, even as that growth average was pulled down dramatically by economic stoppage mandated by the pandemic. If normality is accepted as period between 2014 and immediate prior to the pandemic, then TIPS yields averaged 1.8pp below the 5yr growth rate.
Now, let us take an improbably modest assumption that the rebound of 2021 (currently expected at anything between 4% and 8%) restores effective GDP growth expectations back to pre-covid levels of 2.5%. In those circumstances, we would expect TIPS yields to rise to +70bps, from their current rate of minus 89bps - a rise of 159bps.
If, however, 'normality' is seen as embracing the entire period (2005 to 2019) prior to the pandemic, then the average TIPS yield becomes only 1.1pp below the expected growth rate. If the expected growth rate returns to pre-pandemic 2.5%, we would therefore expect TIPS yields to trend back to 1.4%. That's a rise of 229bps from current rates.
It is hard to swallow, but a resumption of 'normality' in GDP growth from this year implies a rise of approximately 160-230bps in 10yr TIPS yields.
The Problem for the Inflation Premium. The problem for the inflation/capital risk premium is far more obvious: the resumption of 'normal' inflation will, at least in the very short term, push CPI up very sharply this year, which in turn will tend to push up the inflation premium demanded in the bond market.
For now, there is no assumption that the world is embarking on an inflationary outbreak, in response to the great monetary easing of the last few years. Rather, the chart below merely lays out what happens to US CPI yoy rates in the following 12 months based on current (6m) deflection from 5yr seasonalized trends, underlying trend with 1SD deviations above and below. 'Normality' would involve CPI breaking above 3% throughout 2Q, and staying around 2.6%-2.7% for most of the rest of the year. In this case, it seems unlikely that the inflation premium demanded has much room to sink below the 2.32% currently available.
Indeed, if the current very modest 6m deflection against trend is maintained, we will see inflation peaking at around 3.4% by May, before ending the year still around 2.9%. Still less room for any cut in the inflation premium demanded of bond markets.

Putting these together, this produces a range at which US treasury yields are compatible with the resumption of 'normality' - ie 'normal' growth and 'normal' inflation. That range is 3% (TIPS at 70bps and inflation premium steady at 2.30%) to 3.7% (TIPS at 140bps and inflation premium steady at 2.30%).
This cannot be stated too plainly: this is simply 'normality' - ie, what happens if nothing much happens. If you take a more bullish view of likely GDP growth and/or believe that inflation will break higher than 'normal'. then this 3.0%-3.7% range for 10yr treasuries is too low.
Which leads to a final conclusion: financial markets, and a deeply financialized world economy, cannot cope with a resumption of normality like this, which would involve a broad and deep re-pricing of financial assets. We should therefore expect governments and policymakers to improvise energetically to stop it happening. Who know's what they'll come up with now. But there's no road back. 'Normality' is simply too dangerous now.
And, of course, there is an alternative explanation: that US bond markets are right, and specifically, TIPS yields are correctly forecasting a dramatic and disruptive renewed recession. In other words, no return to normality.
