Jul 15•4 min read
Climate Muscle Memory Gym - June 2020
Observation: June's temperature measurements all record the retreat from the slightly scary peaks of early in the year, but there is some way to go to suggest we're now still breaking out from the post 2016 plateau. Meanwhile, there is no evidence at all that the C-19 collapse of the world's industrial and energy production has made the slightest impact on greenhouse gas concentrations. CO2 and methane concentrations continue not only to rise, but the rise is accelerating. The news is better, indeed almost encouraging, for NO2 and sulphur hexaflouride.
Temperatures. June's global temperature measurements extended the retreat from the worrying peaks seen around February this year. According to the Nasa Goddard time series, the surface temperature anomaly dipped 0.1c to 1.27c, which is down from Feb's 1.66c but still markedly higher than June 2019's 1.19c anomaly
The Goddard land and ocean series also dipped 0.11c on the month to 0.93c, which is identical to the measurement for June 2019.
The Spencer lower troposphere satellite series also showed a 0.11c fall on the month to 0.43c, which is down slightly from June 2019.
Overall, however, only the ocean & land series looks to have reverted back to the post-2016 range, whilst the other two suggest the sharp upward trend seen since mid-2018 has not yet been fully stopped. It's reasonable to feel some relief, without pretending that the trend isn't still once again on an a fairly clear upward trend.

Greenhouse Gases. Meanwhile, there is no evidence that the collapse of the global economy has had any measurable impact on global greenhouse gas atmospheric concentrations, at least as far as the Mauna Loa monthly readings are concerned.
Taking CO2 first, concentrations dipped 0.2% mom in June to 416.4 ppm, but CO2 emissions have a regular seasonal fluctuation, and a fall of 0.2% mom is exactly what that seasonal pattern leads to to expect in June. Meanwhile, in yoy terms, concentrations are up 0.6% yoy, and the 6m deflection against trend is very slightly positive.
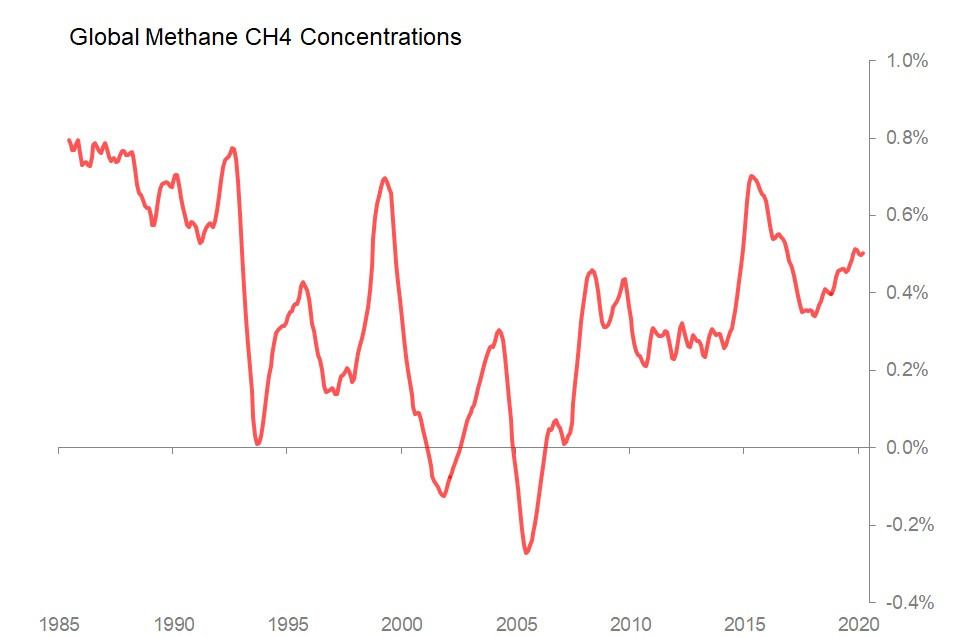
It is too early to be certain that the pandemic will have had similarly undetectable impacts on concentration of other major greenhouse gases, since Mauna Loa data is released only up to the early stages in March. But the available data gives no grounds we should expect an measurable impact. Methane concentrations, for example, rose 0.1% mom in March, and were actually 1.7SDs above historic seasonal trends - trends which are still showing an underlying acceleration. In yoy terms, methane concentrations were up 0.5% yoy to 1876.4 ppb. This acceleration in trend is a relatively recent phenomenon: between 1985 and 2005 the build-up of methane in the atmosphere was gradually slowing, and even turning negative from time to time. Since 2005, there has been a constant rise, which has accelerated noticeably since around 2014. The chart shows growth in concentrations 12ma yoy.
The longer-term trends are friendlier for both nitrous oxide, where the long-term trend shows growth in concentrations is gradually slowing. Not that March's data is extending the argument; concentrations rose 0.1% mom, which was 3.1SDs above what you'd expect in March, and in yoy terms concentrations rose 0.3% oy to 332.8 ppb. Finally, the trace gas sulphur hexaflouride, which although mercifully rare, is a massively powerful greenhouse gas, rose 0.3% mom on the month, which is slightly less than one would expect. In yoy terms, the growth rate is still 3.4% yoy, but the concentration is at only 10.18 pp tr. On a 12m basis, the growth rate is 3.5%, which is as low as it has ever measurably been (in March last year, it was running at 3.7%).