Jul 15•10 min read
Global Inflation Normality - A Running Account
July 15th 2021
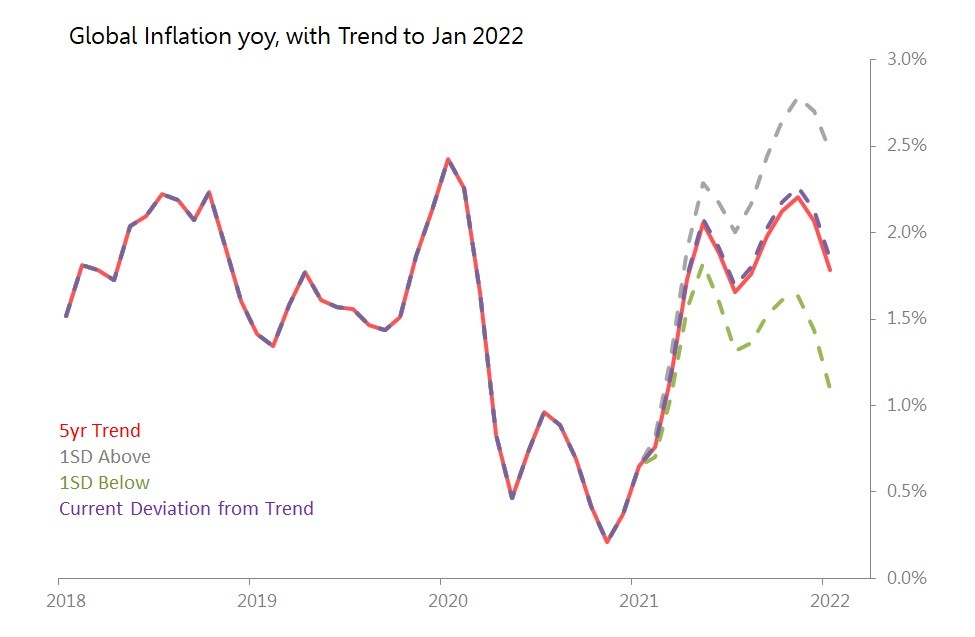
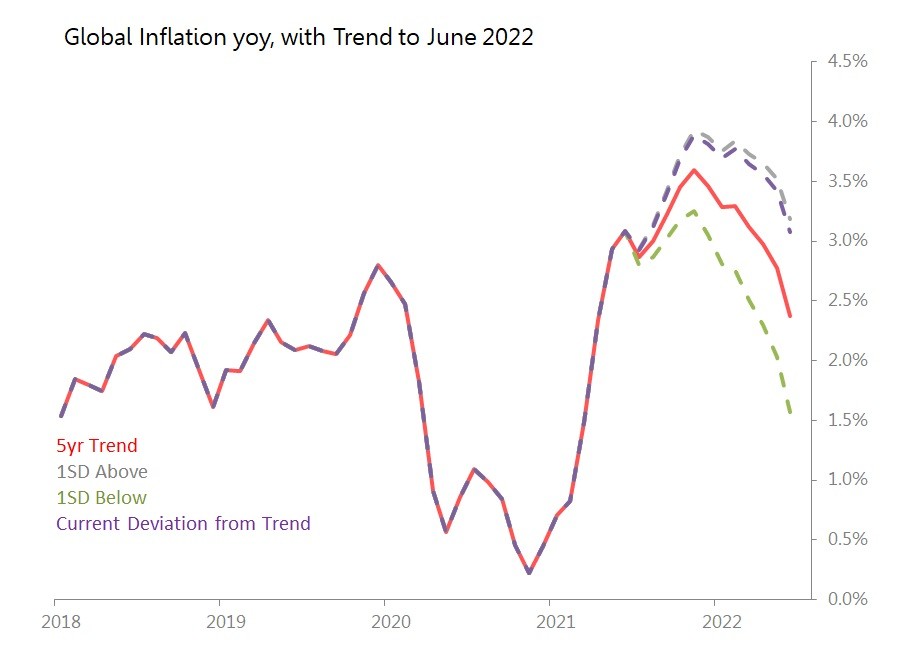
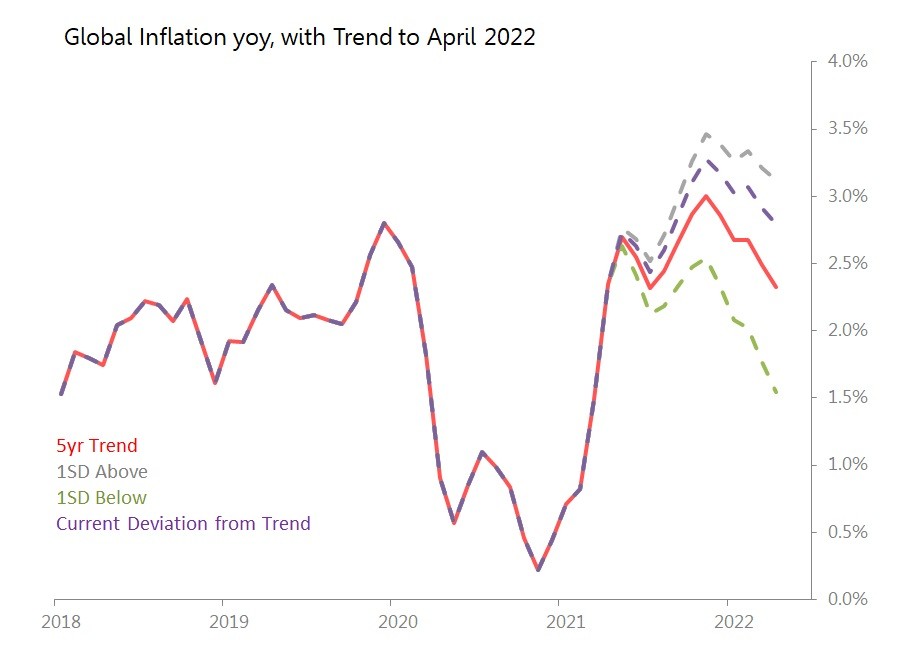
We've come a long way in data and in expectations since I started this review in January, when I calculated that the global 'normal' inflation trajectory would peak at 2.4% Nov 2021 (see below). When we take into account the inflationary outbreak since then, that 'normal trajectory' expects global inflation to peak at 3.9% yoy, although the peak is still in November this year. Under that normal trajectory - generated by extending the current deflection against 5yr seasonalized trend - we won't be seeing anything as low as 2.4% any time in the coming 12 months. These 3.5% numbers for the coming year are also higher than anything seen since the beginning of 2008.
This recent history and this 'normal' likelihood for the coming year should have changed your short-term inflation expectations. If this trajectory plays out, it will also change your medium-term inflation expectations (whether you want it to or not).
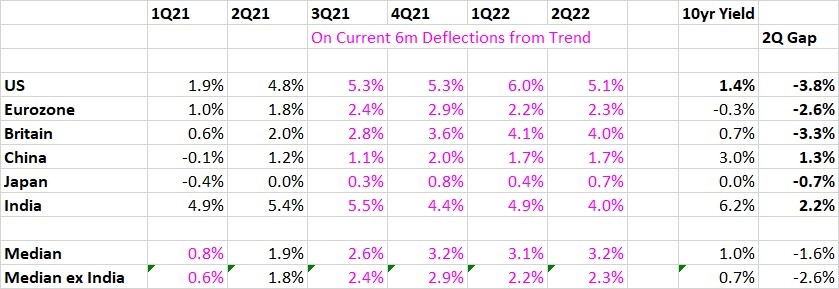
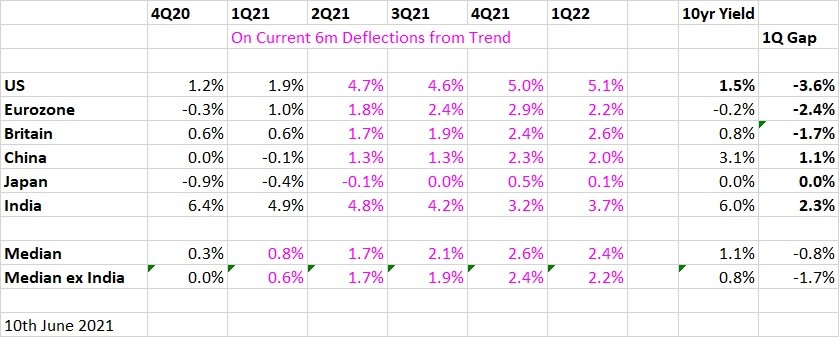
Now let's look at the distribution of the inflationary threat, and the degree to which current 10yr bond market yields measure up to the likely near-term future.
The first thing to notice is that the US is a serious outlier. June's headline rate of 5.4% (5.4%!) means that without a sharp improvement in the deflection against trend (currently running at 1.3SDs above on a 6m basis), we might see inflation of 6.1% around the turn of the year. If the series merely returns to trend, we'll still be seeing 5.3% by January; if somehow the series runs a full SD below trend, we might get down as low as 4.7% by January, and back to 2.4% by June 2022.
Needless to say, the current 10yr govt bond yield of 1.4% looks disastrous, running 3.8 percentage points below likely 2Q22 inflation.
No other major developed economy looks like that, although the UK might yet peak at 4.8% by April next year, and the current 10yr yield of only 0.7% provides a guaranteed erosion of capital. The Eurozone, by contrast, looks likely to peak at 3% in December, before retreating to around 2.3% for most of the first half of 2022. The Euro shows the only actually nominally negative 10yr yield, but even so, the punishment handed out to bond holders in terms of real negative interest rates is less dramatic than in the US or UK. Doubtless the ECB is hoping against hope that this doesn't result in a strengthened Euro.
Finally, the inflation threat simply is not as visible in either China or Japan - where in any case central banks have already toyed with moderating their accommodation. On current data, China's CPI is likely to top out in November at 2.3% before retreating to sub-2% levels in 1H22. With bond yields at 3%, there is a real yield to be had. In Japan, current trends suggest CPI will not manage to hit 1% any time in the coming 12 months.
The inflation story, then, is not really global - it is concentrated in the US, UK and to a lesser extent, Eurozone. And, to be honest, with every month that passes, it looks more and more like a pricing response to the extraordinary monetary policies deployed in those economies.
June 10th 2021
The chance that the current steep rise in global inflation will begin to etch its mark on inflation expectations is rising. This, of course, is the worst possible outcome, not least since the world's major central banks seem to cling to the belief that if they can somehow keep inflation expectations from igniting, then they need not worry about other consequences of quantitative and qualitative easing. Expectations, it turns out, are everything - as long as Wile E Coyote doesn't look down, monetary policy is working.
I still tend to believe that the current inflationary outbreak is reflecting a misalignment of supply and demand curves which is anomalous and therefore most likely temporary (albeit that an era of de-globalization means we should expect higher 'normal' inflation in the medium and long term).
But if inflationary expectations kick in, all bets are off.
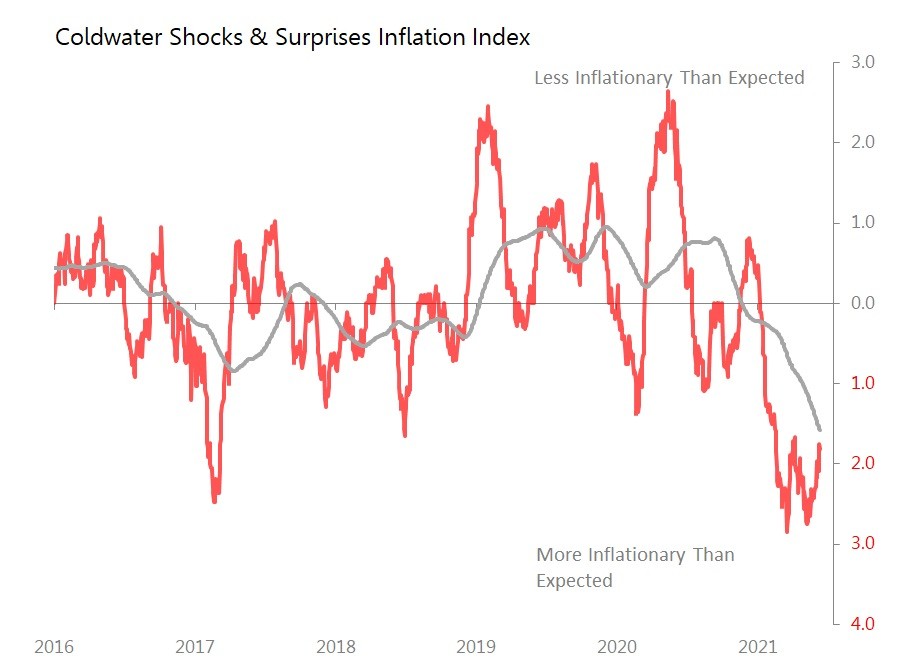
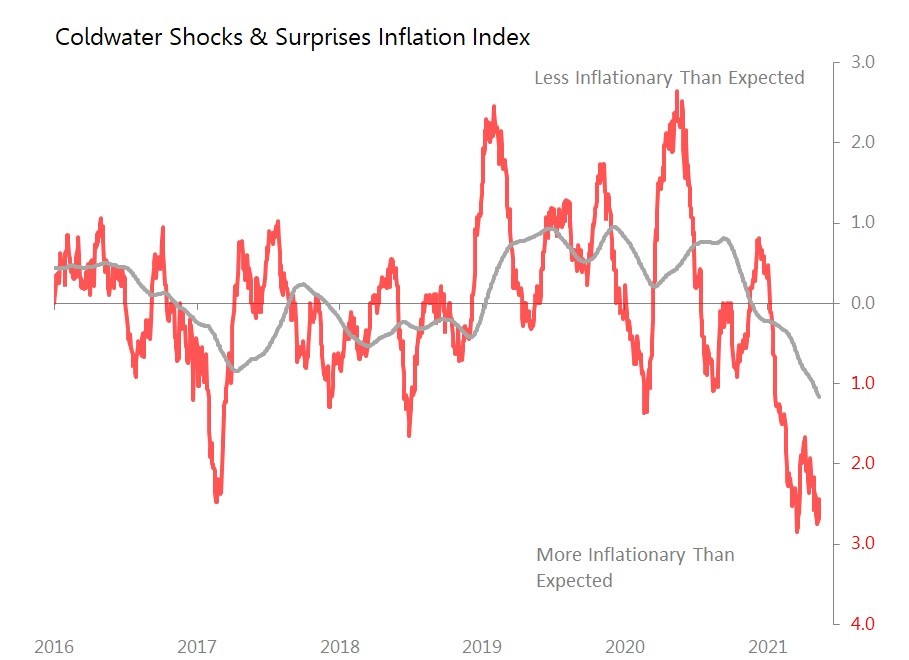
The Shocks & Surprises inflation index has no comfort to offer: six months after inflation numbers started shocking consensus, they continue to do so. Today's contribution to the inflation-shock data included US Core CPI rising 0.7% mom and, before adjustments, rising 3.8% yoy with a monthly movt 2.1SDs above historic seasonal trends; and Japan's domestic PPI - Japan, for goodness sake - rising 4.9% yoy, with a monthly movt 1.1SDs above trend. The fact that the US's headline CPI hit 5% yoy and it didn't even register as an out-of-consensus shock, tells its own story.
The extended run of inflation shocks is now generating a significantly sharper 'normal' global inflationary trajectory over the coming year (to May 2022). When I started this 'normal' inflation tracking exercise back in January, the calculation was that we should expect global inflation to peak at 2.4% in November this year. That future is long past: in May, I calculate global CPI (based on weighted contributions from US, Eurozone, and NE Asia) rose to 2.9% yoy, and if the deflection above trend seen over the last six months persists, we can expect November's peak to hit 3.6% yoy. Moreover, 3%+ rates will persist throughout the first half of next year.
If historic seasonal patterns and trends are recovered, we are still looking at a peak of 3.2% in November this year.
May: Global 'Normal' Inflation Trajectory, Peaking 3.6% Nov 2021

Meanwhile, bond markets in developed economies continue to ignore completely the possibility that 'normal' inflation is going to be significantly higher in the future than in the recent past. The risk of a bond market 'accident' has therefore risen. The risk is highest in the US, where if you graft the most recent data on to the 6m deflection against 5yr trends, CPI reaches 5.1% in 1Q22, whilst current 10yr yields are just 1.5%. This gap between likely inflation and actual bond yields therefore widens to 3.6 percentage points, up from the 2.8pps this time last month.
The mismatch between likely CPI and current yields has also widened in the UK, to 1.7 percentage points (1Q22 CPI of 2.6% vs 10yr yields of 0.8%), up from 1.1pp this time last month.
The gap in the Eurozone is unchanged at 2.4pps (1Q22 inflation of 2.2% vs 10yr yields of minus 0.2%).
May 12th 2021.
The global inflation threat is getting worse, not better. The Shocks & Surprises inflation index's double dip is consolidating, pushing the 12m line down even further. So far, there is only modest evidence that this experience is seeping into a serious rise in inflationary expectations, but the longer that 12m tally stays deeply below the line, the more likely an impact on inflationary expectations becomes. The NY Fed's April survey of expectations showed 12m inflation expectations inching up to 3.36%, the highest since 2013, but 3yr expectations were (still) almost unchanged at 3.10%, still well below the levels endured in 2013.
April's CPI readings contained some nasties, of which the worst was the US where CPI rose 0.8% mom sa and no less than 4.2%, with a monthly deflection above trend of 2.1SDs. Core inflation did no better, rising 0.9% mom and 3% yoy, with the monthly movt 2.9SDs above trend. But in addition, the Eurozone's 1.6% yoy CPI result was generated by a monthly movt 0.5SDs above trend.
In Asia, the results are not so worrying: China's 0.9% yoy rise was the result of a monthly movt 0.2SDs below trend, and overall, NE Asia's weighted CPI rise of 0.8% yoy was delivered by a monthly movt 0.1SDs below trend.
The matrix setting out the quarterly trajectories for the coming year, based on current 6m deflections from trend show substantial revisions this month. There is a very sharp upward revision for the US in response to today's honestly shocking CPI results.. We can now anticipate rates sustained above 4% for the coming year, which seems incompatible with 10yr yields remaining at 1.6%. This is the biggest gap between current 10yr yields and likely 12m inflation trajectories on the board. Indeed, this negative yield gap is now larger even than in the Eurozone. By contrast, there are substantial downward revisions for Japan, with the result that JGB yields of 0.1% look, believe it or not, reasonable.

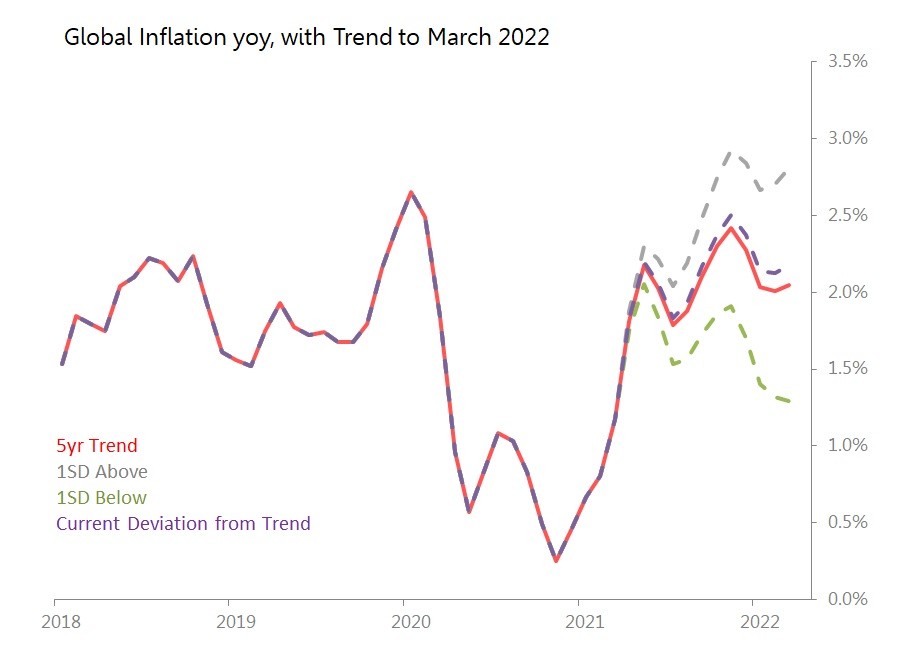
April: Global 'Normal' Inflation Trajectory, Peaking at 3.3% in Nov 2021
April's results have resulted in a sharp revision higher of what we can expect the 'normal' inflationary trajectory to look like. Global CPI rose to 2.3% yoy in April from 1.5% in March, and is likely to stay above 2.3% from here. The peak of global inflation still looks likely to show in November, but that 'normal' peak is now 3.3% (up from 2.5% seen last month). There is no reason to expect that global CPI will retreat to below around 2.3% in the coming 12m.

April 21st, 2021. There is no let-up yet in the Shocks & Surprises Inflation index shows, with the initial shocks from January's data being amplified by results from February and March. This double-dip in the chart suggests a more difficult inflationary outbreak than we've seen during the chart's history. The most likely outcome continues to be that supply and demand curves shift benignly in ways which prevent inflationary expectations getting a grip. However, it's worth keeping an eye on trends in liquidity preference (M1/M2), because if that starts to rise sharply, it is a good early-warning sign that inflationary expectations are abroad.
For March , US CPI rose 2.6% yoy, Eurozone +1.3%, and NE Asia at +0.3% yoy (China +0.4% yoy, Japan minus 0.6%, S Korea +1.5%, Taiwan +1.3% and Japan around minus 0.2%).
How alarmed should we be? Figuring out what is 'normal' inflation, which we should not be unduly worried about, and what is shaping into a problem, will be an ongoing task. In January, I produced a chart for what 'normal' inflation would look like over the coming year, based on a weighted CPI including US, Eurozone, Japan and China. Each month as new CPI results come in, this chart, with its fan-spread of possible outcomes, will be updated. The point is not only to update what 'normality' currently looks like, but how that 'normality' has shifted over the months.
March: Global 'Normal' Inflation Trajectory, Peaking at 2.5% in Nov 2021
March +1.2% yoy, with deflection from 5yr seasonal trend +0.57SDs, with 6m deflection of Minus 0.04SDs
The matrix for major economies, showing currently likely quarterly outcomes, and comparing current 10yr bond yields. It suggests plenty of scope for inflation concern in the US over the coming 12 months.

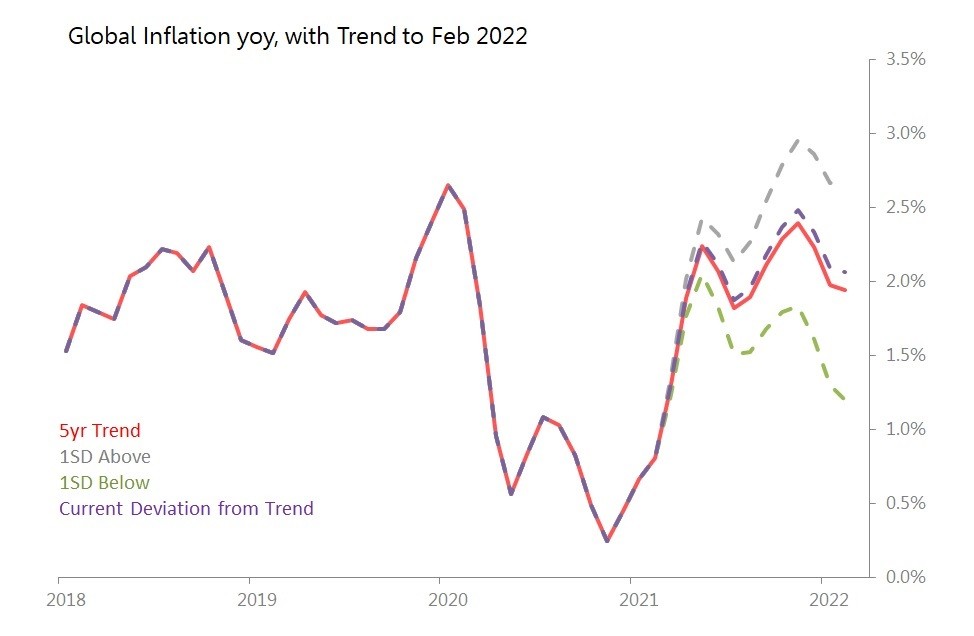
February: Global 'Normal' Inflation Trajectory, Peaking at 2.5%% in Nov 2021
Feb +0.8% yoy, with deflection from 5yr seasonal trend +0.24SDs, with 6m deflection of +0.16SD
January: Global 'Normal' Inflation Trajectory, Peaking 2.4% Nov 2021
Jan +0.7% yoy, with deflection from 5yr seasonal trend +1.9SDs, and 6m deflection of 0.08SDs