Nov 27•3 min read
US: How Expensive is SPX? An ROC and Profits View
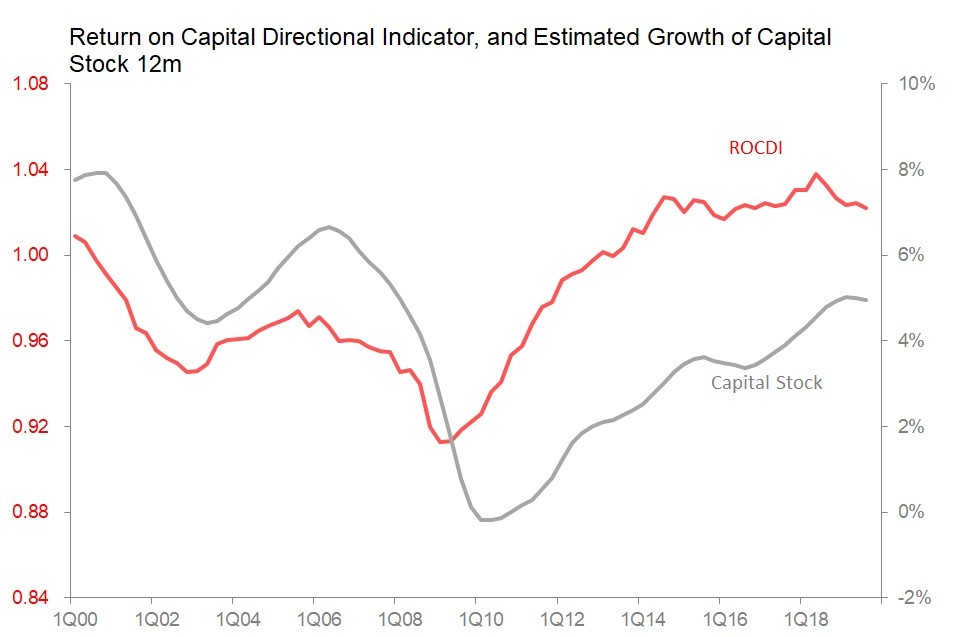
The 2nd estimate of 3Q GDP upped the annualized growth rate to 2.1% from the initially estimated 1.9%. The slight upward revision slightly alters the picture for our Return on Capital Directional Indicator (ROCDI), and also for Kalecki profits.
With total capital stock growth easing to very slightly under 5%, whilst final spending on domestic product (FSDP) is growing 3.9%, the ROCDI continues to drift downwards. However, since capital stock growth is now decelerating, whilst FSDP growth has probably bottomed, it seems unlikely that the ROCDI has much further to fall, and very unlikely that it is likely to fall from the plateau established in 2014. By extension, the current retreat of the ROCDI seems unlikely to be steep enough to trigger a serious or extended investment recession, even though nominal growth in private investment slowed to 0.5% annualized in 2Q and 0.1% in 3Q, with non-residential falling an annualized 2.1% in 3Q.
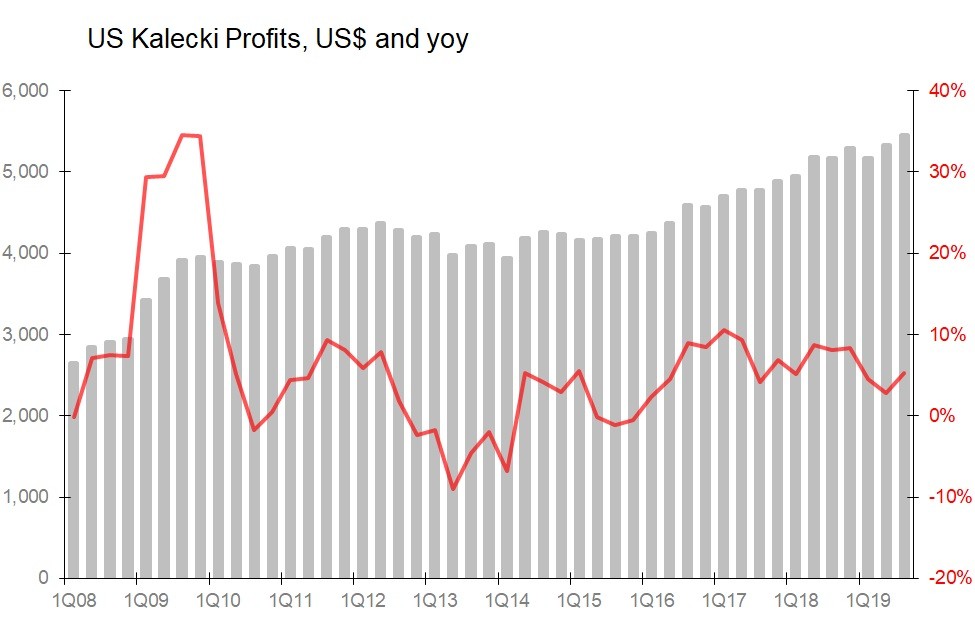
Meanwhile, despite the downward drift in the ROCDI and the topping out of capital stock growth, the Kalecki profits calculations continue to improve. In the 12m to 3Q, Kalecki profits rose 5.3% yoy, recovering from 2Q's 2.8%. The 5.3% yoy rise in Kalecki profits was, of course, slightly faster than the annualized rise in nominal GDP of 3.8%, so profits as a percentage of GDP inched up to 25.3% - a peak it has reached previously in 2Q18 and 4Q18.
However, the continued rise in Kalecki profits continues to be generated mainly by the rise in government dissaving (ie, the fiscal deficit). Kalecki profits rose $275bn yoy in the 12m to September, and of that, the rise in the government deficit accounted for $205bn. By comparison, the rise in household sector dissaving slowed, to add only $61bn, and the narrowing of the trade deficit added a further $20bn. However, these gains were partly offset by the $12bn fall in the contribution by net investment (ie, the depreciation on estimated capital stock was slightly higher than current private investment spending).
Moral: whilst Kalecki profits are still growing, their continued rise is worryingly dependent on the US government deficit continuing to rise. It's a government-funded profits boom.
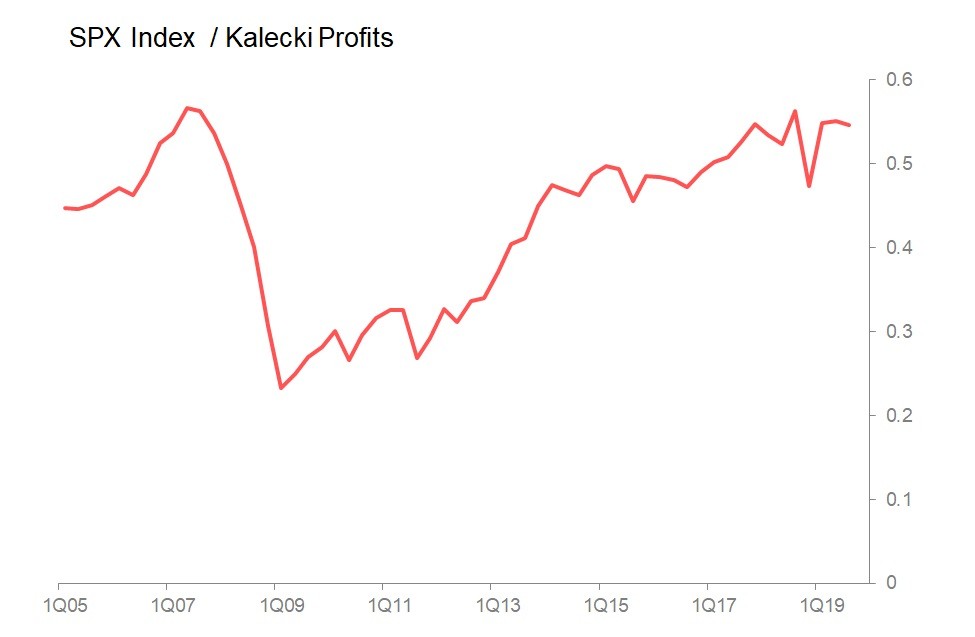
One final point: it is possible to compare the history of Kalecki profits with the history of US equity prices, in this case proxied by the S&P500. The following chart simply divides the SPX Index value by the value of Kalecki profits. If the Kalecki profits calculations are a reasonable approximation of underlying profits generation, then this will ratio will be a guide as to how expensive the S&P current looks.
And, in short, it looks near its historic peak - particularly so if 2020 is a year of moderated fiscal expansion.