Mar 18•7 min read
View from the Windscreen, Hurtling Down (La Peste, La Chute)
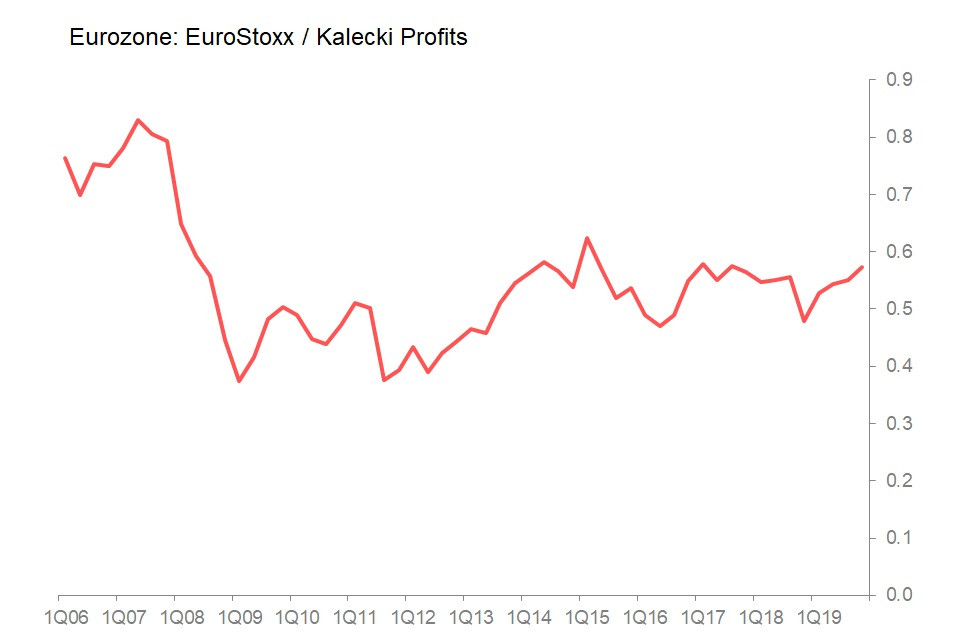
The structure of Eurozone profits disclose a heightened vulnerability to the likely negative impact of the global coronavirus recession, but there is better news about the valuations of those profits. As the chart below shows, valuations of the EuroStoxx index relative to Kalecki profits ended 2019 at historically unchallenging levels. In fact, the valuation of Eurozone profits has been little changed since 2013. Even in the best of times, scrutinizing the data to get an idea of what the future holds is driving whilst looking in the rear mirror. While it has its limitations, I think that's usually not entirely useless: as situations develop, understanding their early trajectory can limit the field of likely outcomes. But right now, the rear-view mirror isn't going to help much, because about three weeks ago we drove off a cliff, and if what we're seeing in the mirror is the road unwinding, we will fundamentally misunderstand our situation, our future.
Instead, the questions it would be useful to be able to answer are things like: how high is this cliff we've just driven off? Just how well put together is this car - what will be left after we hit the ground? Do we, by any chance, have a parachute?
My starting effort to figure out some answers goes something like this. First, how vulnerable is the economy's profits profile (ie, how well put together is the car)? How vulnerable are financial asset prices to a profits crash (how high is the cliff)? What is the state of our cashflows going into this crash (do we have any sort of parachute)?
It seems certain that the global economy is experiencing the worst and most sudden gap-down in output the post-war generation has seen. Attempts to put numbers on it are premature, particularly since the lizard-brain panic reactions currently foremost, whilst immediately economically disastrous, also seem to guarantee this will not be over quickly. Shutting down entire economies, sealing off whole countries from outside contact, may - just may - be able to halt the initial outbreak in individual countries. But unless the coronavirus is eradicated globally, then shortly after those restrictions are lifted, it will be back. Will those countries shut themselves down again? How many times will this pattern have to be repeated?
Britain's project of 'herd immunity' is certainly controversial, and seemingly accepts as inevitable a death-toll which cannot be admitted publicly. It is, however, probably what will have to be achieved by every country eventually, one way or another.
In the meantime, we can probably sketch out some likely shapes of the economic disaster unfolding:
First, investment will collapse;
Second, international trade will dwindle in the short, medium and possibly long-term (depending on how the lizard brain acclimatises);
Third, fiscal balances will deteriorate spectacularly as governments necessarily act to preserve what they can of our current social, econoimc and financial infrastructures;
Fourth, whilst private consumption will fall sharply, it will probably fall less sharply than wages and conpensation. Surplus private savings flows (both corporate and household) will dissipate.
If these are the likely characteristics of our immediate future, then it gives us some insight into the likely vulnerabilities of economies. In this case, there are significant diffferences between the US and the Eurozone.
US Characteristics
Profits have been growing consistently and strongly since the end of 2015. More, the main source of Kalecki profits is household sector dissaving; and the most strongly growing source of profits is the rising fiscal deficit. This structure means the US profits profile is significant less vulnerable than those of the Eurozone.
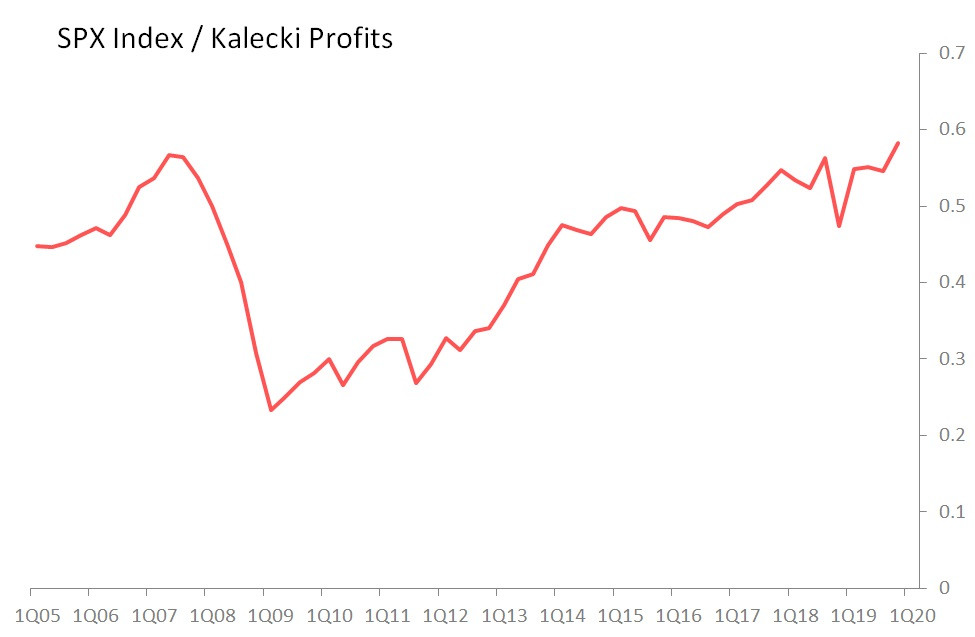
However, the valuation put on those profits, expressed here as SPX Index/Kalecki profits, entered 2020 at historic highs.
The potential for a fall in equity prices is therefore correspondingly high, with both the numerator and denominator of this equation certain to fall.
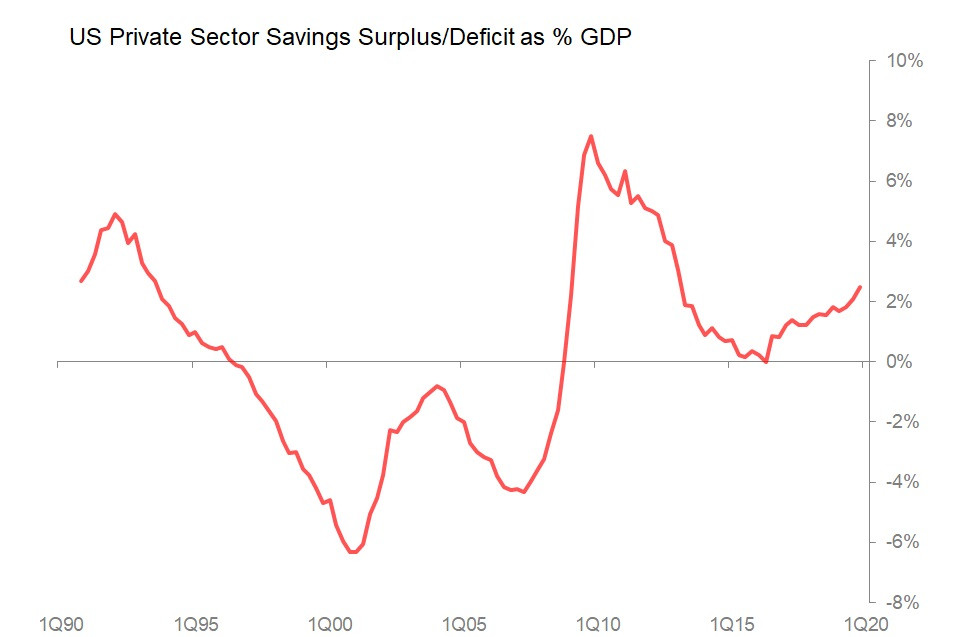
Meanwhile, prior to this catastrophe, the US private sector was generating a savings surplus equivalent to 2.5% of GDP, the most positive cashflow result since the beginning of 2013, although well below post GFC levels.
Kalecki profits - the news is still good, growing at 4.9% in 2019, compared with nominal GDP growth of 4.1%.
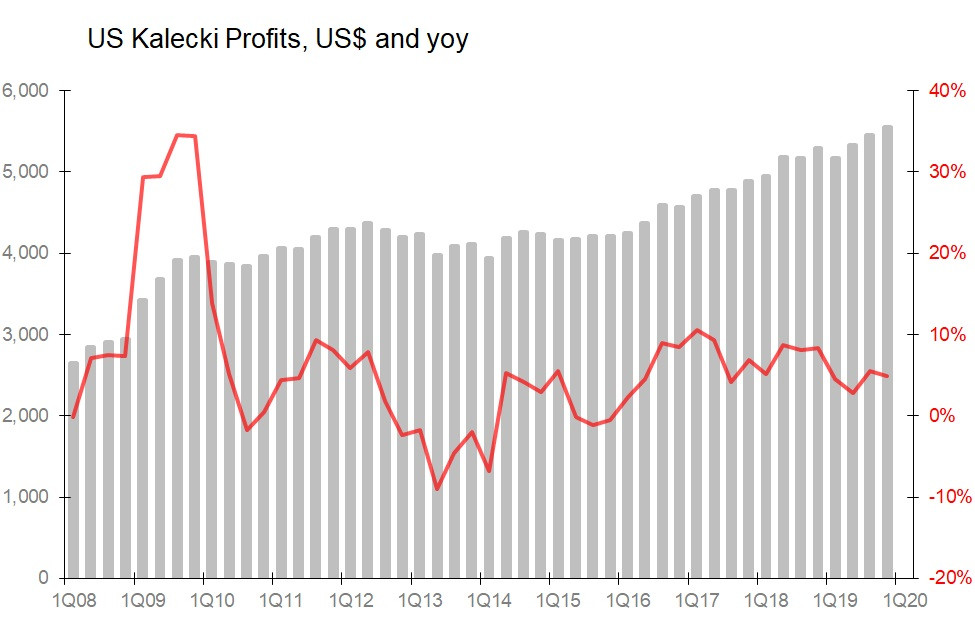
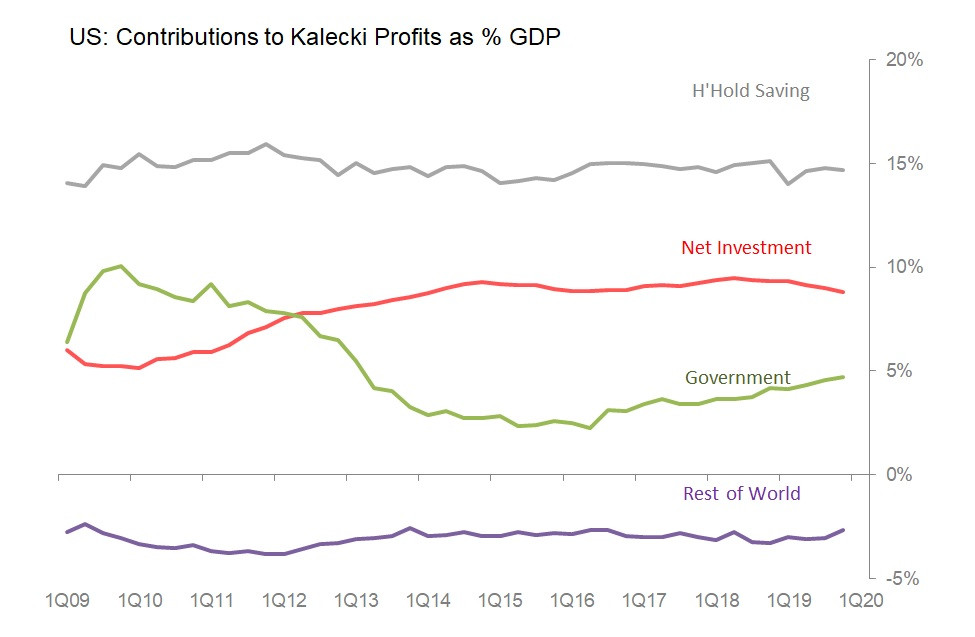
Kalecki breakdown: the most significant contributor to profits is household dissaving - ie, the excess of consumption over compensation, which accounts for 57% of profits; followed by net investment at 35%, government dissaving at 18% and savings made by the rest of the world relative to the US, at minus 10%.
As as result, the structure of the US's Kalecki profits is relatively favourable, primarily owing to the relatively small part played by net investment, the relatively large contributions from household and government dissaving, and the negative imapct of trade balances.
Valuations Vulnerability: Kalecki/SPX
However, the initial valuation of US financial assets relative to Kalecki profits entered 2020 at an all-time high - clearly, then, vulnerable to the expected fall in profits.
Cashflows, measured by the Private Sector Savings Surplus (PSSS). Private sector cashflows in the US have been rising consistently since the middle of 2016, and by end-2019 were the equivalent to $538bn, or 2.5% of GDP, the highest proportion sinc the beginning of 2013.
Eurozone Characteristics
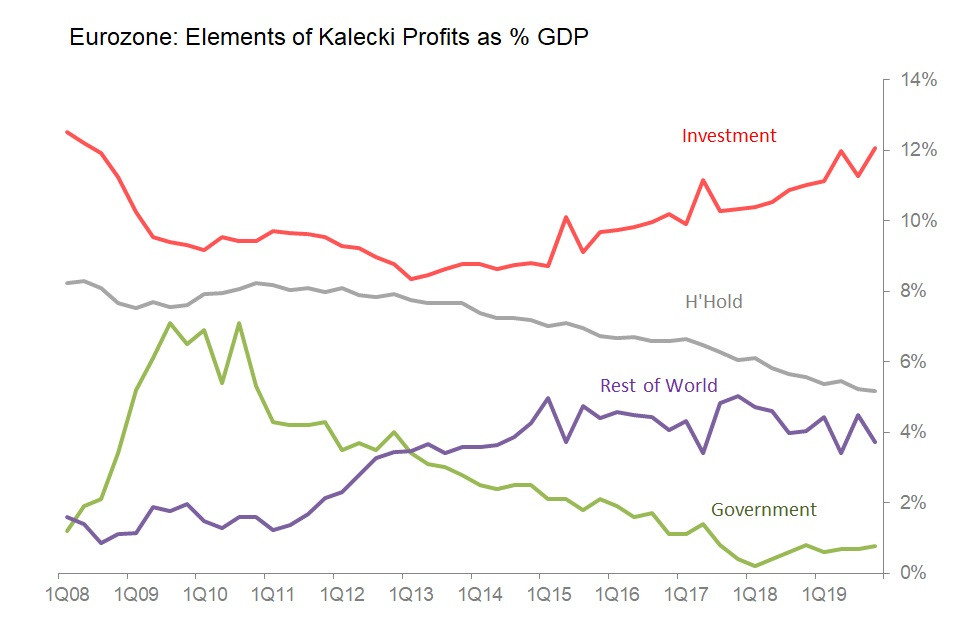
Until last year, Kalecki profits had been little changed in nominal terms for a decade, and have fallen from a peack of 26% of GDP in 2009 to just 21.7% in 2019. Alarmingly, the biggest contributor to the profits calculation is net investment, which is the source of 55.6% of profits. In addition, the Eurozone's trade surplus accounts for a further 17% of profits. Since these are the two sources most vulnerable in current circumstances, the outlook for Eurozone profits is profoundly bleak.
In addition, the extent to which the EU's mandated fiscal constraints are relaxed and broken, and the feedback this has on monetary policy disputes, remains to be seen. On paper, a degree of fiscal/monetary cooperation and generosity previously unachieved seems absolutely necessary.
Set against that, however, is the positive characteristic that unlike in the US, there is no obvious historic over-valuation of Eurozone profits in European stockmarkets.
As with the US, the private sector has persistently generated a savings surplus, indicating positive cashflow into the financial system. This has been dwindling steadily, and entered 2020 at 3.7% of GDP. The problem, of course, is that this is earned mainly through current account surpluses which now looks very vulnerable.
Kalecki profits: Little happened in Kalecki profits between 2009 and end-2018, but 2019 saw the best sustained growth since 2014.
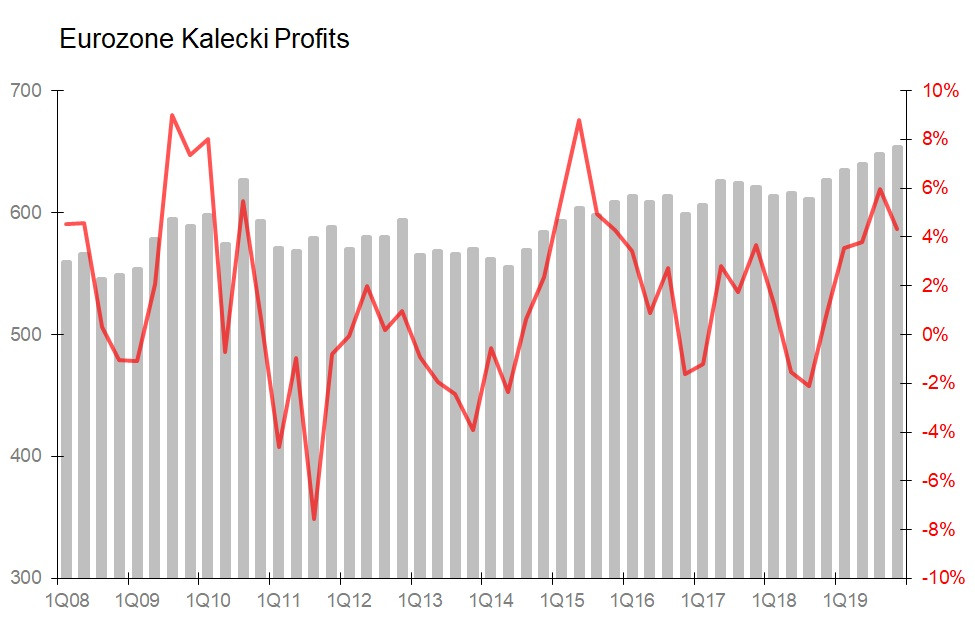
Structure of Kalecki Profits: But the structure of those profits looks very vulnerable to the impact of the virus, In particular, profits are led by net investments, which in 2019 accounted for 55.6% of profits, the highest ratio in recent history. And it is net investments which are the most likely to tumble in the global recession. By contrast, the two contributors most likely to increase their contributions are household dissaving, which makes up only 23.8% of profits, and the government deficit, which makes up 3.5% of the total. If total trade volumes dwindle, as they surely must, then this is another vulnerability as net exports account for 17% of profits.
The structure of Eurozone profits disclose a heightened vulnerability to the likely negative impact of the global coronavirus recession, but there is better news about the valuations of those profits. As the chart below shows, valuations of the EuroStoxx index relative to Kalecki profits ended 2019 at historically unchallenging levels. In fact, the valuation of Eurozone profits has been little changed since 2013.
Cashflows: The Eurozone has maintained positive private sector savings surplus flows into the financial system since 2009, with the surplus generally in slow retreat since around 2013. In 2019 it narrowly reversed this fall, rising to 3.7% of GDP during the year.
