Feb 18•4 min read
Global Inflation in 2021: The Shape of 'Normal'
Without wanting to make any wider claims about 'inflation, reflation, or stagflation', here's what we can expect to happen to global inflation this year if everything is absolutely normal.
In 2020, global inflation fell to 1% yoy on a 12ma, down from 2019's 1.6%. If the trends of the last five years are maintained, then we can expect global inflation to rebound to 1.7%, with a lower tolerances of 1.4% (1SD below trend) and an upper tolerance of 2%.
If the current 6m deflection from trends are maintained, the result will be almost indistinguishable from trend, ie, 1.7% yoy on a 12m basis.
Within that average, however, we should expect some quite dramatic, and possibly even unnerving shifts in trajectories. Between now and May, yoy rates will rise sharply to a peak of around 2%, after which there will be some mild relief before the yoy numbers climb again to a peak in November. Here are the tolerances:
May peak: Trend 2.1%, with range of 1.8% to 2.3%
Mid-Year Retreat: Trend 1.7%, with range of 1.3% to 2%
November peak: Trend 2.1%, with range of 1.4% to 2.7%
Once again, I want to emphasize: if what happens falls between these boundaries, then essentially there is nothing interesting happening to inflation - there is simply no story.
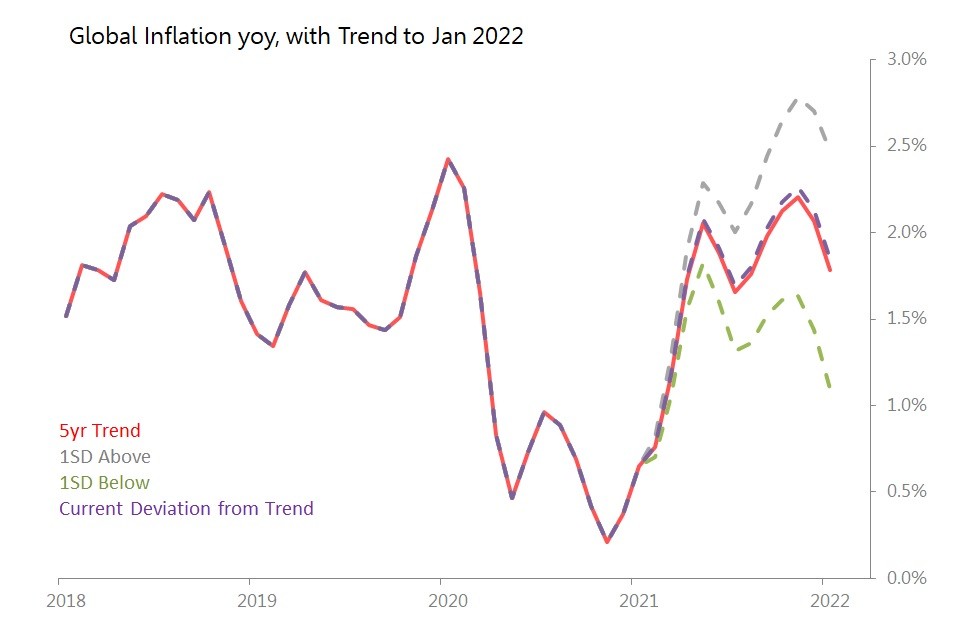
Note: This global CPI chart is based on the CPIs of the US, Eurozone, China, Japan, S Korea and Taiwan, with a weighting reflecting 5yr average nominal US$ GDP sizes. The seasonal trend is calculated as the average of each month for the past five years (ie, for January this year, the 'trend' in monthly movts is the average of the monthly movements in the previous five Januaries). Errors from that trend are noted each month, and this in turn a) corrects the underlying trend if necessary, and b) measures the standard errors experienced over the past five years.
Taking each of these countries in turn, starting with the US.
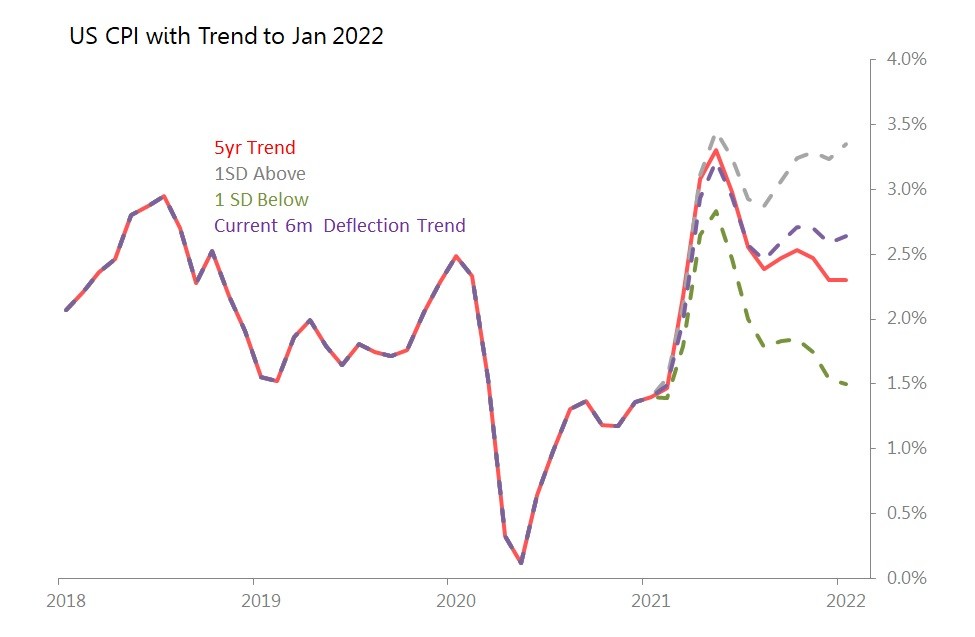
US Trend is for 2.5 % yoy 12ma, with peak of 3.2%-3.3% in May 2021
Trend 2.5% yoy 12ma in year to Jan 2022, with 1SD above a 3% and 1SD below at 1.9%. Current deflection from trend implies 2.6% yoy 12ma.
The median yoy for the year is 2.5% - 2.6%.
However, as the chart shows, the first half of the year will see a very sharp upturn, with yoy comparisons quite possibly rising above 3% during 2Q21, and probably staying above 2% through to Jan 2022.
insert us cpi fan.jpg
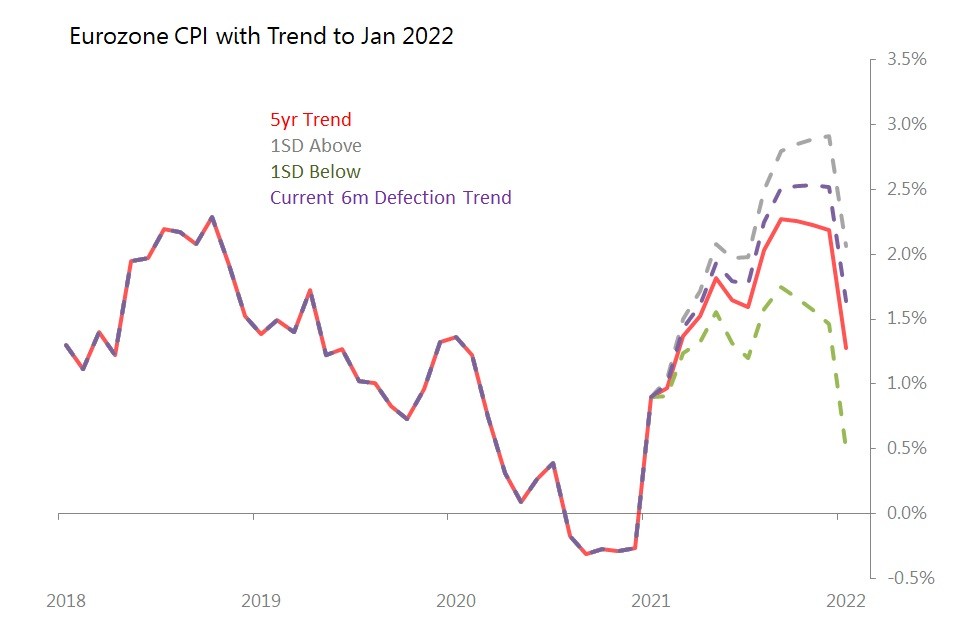
Eurozone Trend is for 1.7% yoy 12ma, with 2% Levels Sustained in 2H21
Trend 1.7%% yoy 12ma in year to Jan 2022, with 1SD above at 2.2%% and 1SD below at 1.3%. Current deflection from trend implies 2.0% yoy 12ma.
The median yoy for the year is 1.7% - 1.9%
As the chart shows, we should expect the Yoy rate to rise fairly consistently throughout the year, with interim peaks of around 1.8% in May, and a secondary peak in 4Q.
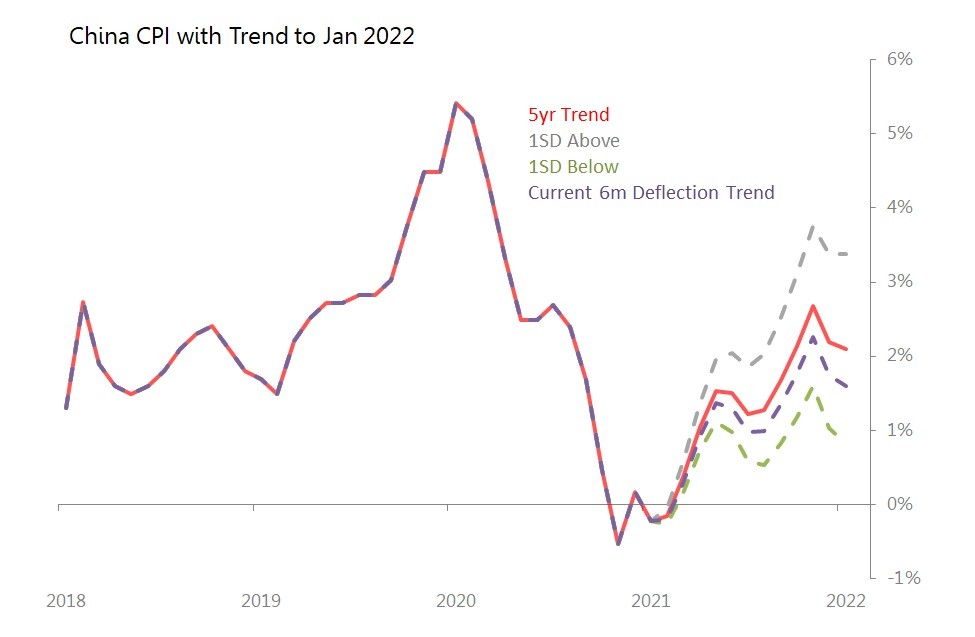
China Trend is for 1.5% yoy 12ma, with rates rising rapidly in 2H, likely to peak around 2.5%
Trend is 1.5%% yoy 12ma in year to Jan 2022, with 1SD above at 2.2% and 1SD below at 0.8%. Current deflection from trend implies 1.2%% yoy 12ma.
The median yoy for the year is 1.2% - 1.5%.
The chart shows, we should expect yoy rates to rise, with an early peak in May-June around 1.3% - 1.5%, but rates continuing to rise, quite sharply, in the second half of the year, with a second peak in November, of around 2.3% to 2.7%.
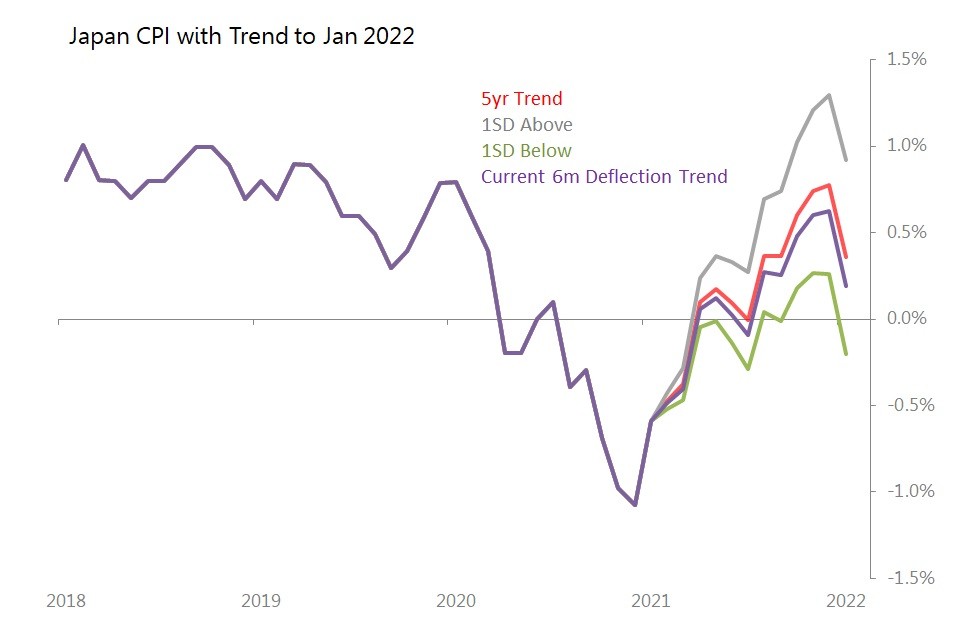
Japan Trend is for 0.2% yoy 12ma, with
Trend is 0.2% yoy 12ma in year to Jan 2022, with 1SD above at 0.5% and 1SD below at minus 0.1%. Current deflection from trend implies 0.1% yoy 12ma.
The median yoy for the year is 0.2% to 0.3%.
The chart shows, we should expect yoy rates to remain very subdued in the near term, with noticeable yoy rises starting only around August, though with the rise sustained through to the end of 2021.
insert japan cpi fan.jpg
