Nov 17•4 min read
The Shape of Things to Come
No-one should have faith in economic forecasting: if knowledge of that kind was truly possible, the argument for free markets would be lost for ever, since centrally planned economies would outperform every other model. The reason: the argument for competition is precisely that it discovers information which cannot be discovered in any other way (thank you Mr. Hayek).
Nevertheless, some of the work I do makes it possible to peer into the near future with confidence as to the general shape of things to come. In particular, some of the work I do on tracking monetary conditions gives us good reason to know how to adjust our expectations of economic outcomes - specifically whether we should expect to be surprised or shocked at how things develop.
On a global level, for example, fluctuations in my monetary conditions indicator quite reliably foreshadow movements in the Coldwater global shocks and surprises indexes by approximately six months. This has been true for the last seven years, and even the unprecedented volatility of a global pandemic has disrupted it only mildly and temporarily.
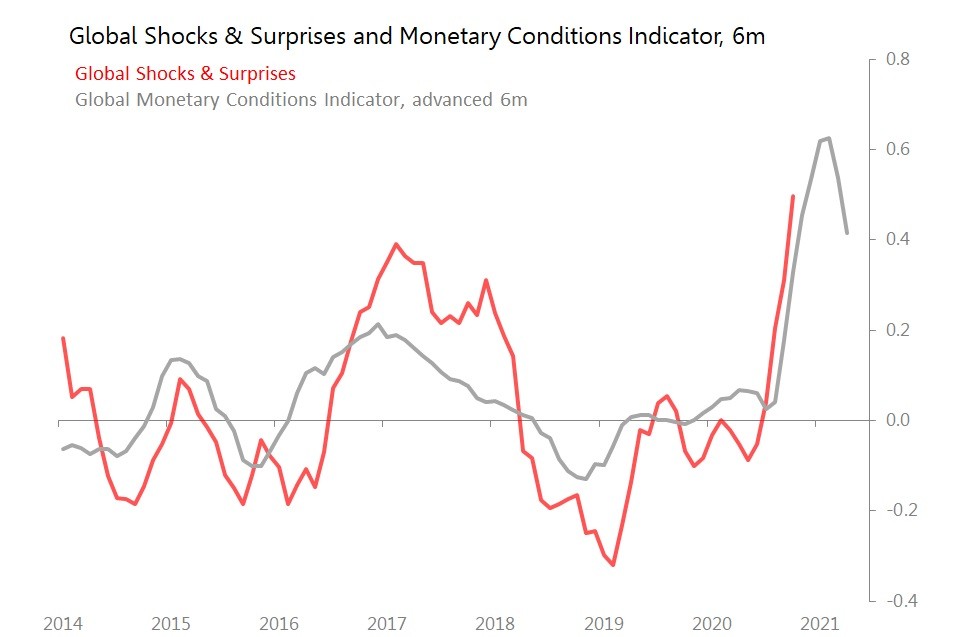
Generally speaking, you should expect to continued to be 'surprised' for the next couple of months, before disapointing economic outcomes dim this optimism gradually from around the end of the first quarter.
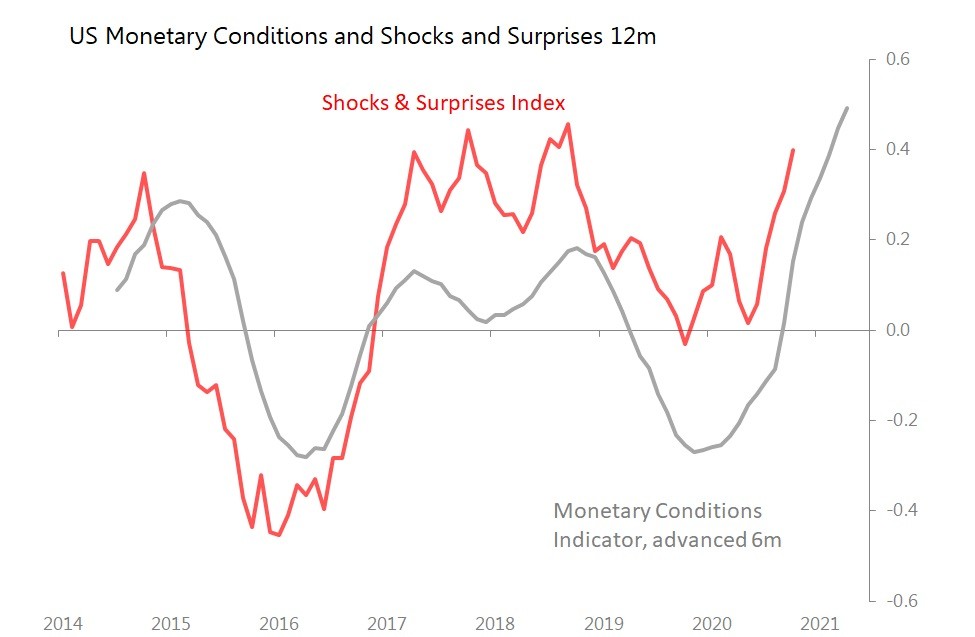
The same sort of relationship between the monetary conditions indicator and the US ability to shock or surprise us with its economic data holds true. As with the global situation, so with the US, we can expect the news to remain positive for the next few months before beginning to dim by around the end of the first quarter.
These sorts of charts naturally arouse suspicion - if something looks too good to be true, it usually isn't, and, after all, you can do anything with charts, can't you? You must make these judgments for yourself, but here's the case for the defence.
First, as a general rule, it is not so surprising that changes in underlying monetary conditions will have some consequences for economic activity and behaviour. Generally one would expect changes in economic signals to follow, with a lag, a similar direction to changes in monetary conditions, as it does in these charts. If this is actually true, then the challenge is to track things properly.
Aside from that theoretical likelihood, there is no methodological reason why these two indexes should be related in this way. The monetary indicator indexes track the deviations against trend or l/t average in what I consider the four important aspects of money: i) how much of it there is; ii) what's happening to its international value; iii) the long-term cost of it and iv) the time-preferences of holding it expressed in the yield curve. The monetary conditions indexes constructed for separate countries average the standard deviations of these four aspects of money. The global indicator then uses a 5yr nominal dollar GDP average weighting to include the US, Europe, China and Japan. I started calculating and publishing these indexes approximately a decade before I started compiling the shocks and surprises indexes.
The global shocks & surprises index simply aggregates the results of the c500 separate pieces of economic data I track each month. I make no weighting intervention in this index, either for individual countries or types of data: I believe the sample is big and broad enough to stand on its own. There is, however, an assumption that over time, the shocks and surprises I track are normally distributed.
In other words, from a methodological point of view, these are separately calculated indexes, and the fact that they do seem to be related to each other in the way basic economic common sense would expect suggests neither are major mistakes. They do not generate specific forecasts, but can probably continue to be trusted as giving a rough outline of the shape of things to come.