Jan 23•5 min read
Climate Data: Time to Develop Muscle Memory
Given the amount of attention given to climate developments by politicians, media and increasingly corporate bosses, it is surprising that key datapoints in this argument do not feature in the regular calendar of economic news. Regardless of what one ultimately believes about the veracity of claims about climatic developments and their causes, and regardless of the degree of scepticism one has about the practical and conceptual difficulty of producing, let alone interpreting, such popular metrics as 'global temperature', this information is likely to matter in ways we should probably not ignore.
At a minimum, we are dealing with the impact of information here, not the impact of climate change itself.
Now, most people reading this post will be absolutely used to being immersed in economic data. It is the ocean we swim in, and as a result, over the years, even if you don't spend your days analysing or forecasting it, you develop a powerful muscle memory. That muscle memory quickly sifts the important from the irrelevant, and with practice, it smells bullshit narratives a mile off. We need to develop that muscle memory for environment/climate data. We need that muscle-memory to protect against both complacency and hysteria.
As a start, I am following three different monthly data-sets.
First: data about greenhouse gas concentrations collected at the Mauna Loa station of the Earth System Research Laboratory: this includes CO2; CH4 (Methane); N2O (Nitrous Oxide); and SF6 (Sulfur Hexaflouride).
Second: Monthly global temperature data from NASA's Goddard Institute for Space Studies, comprising land temperatures and land & ocean temperatures
Third: the UAH Satellite-based record of global temperatures in the lower atmosphere, reported by Dr Roy Spencer.
In each case, I intend to track monthly movements, their deviations from underlying trends, and the average 12m deviation from trend. I am not at this point committed to significant interpretation about the causes or consequences of these deviations. I merely think that consistently following a these data will help build the sort of 'muscle memory' which will render us less vulnerable to excitable coverage.
Greenhouse Gases
Carbon Dioxide: In December, atmospheric CO2 concentrations rose 0.4% mom to 411.76 parts per million. The monthly movt was 0.1SD above historic seasonal trends, I measure that trend with a monthly average of 0.002%, and a standard deviation of 0.108%. In 12m terms, concentrations rose 0.7% yoy, and the 12m deviation from trend was +0.04.
Methane: In September, atmospheric methane concentrations rose 0.4% mom to 1870.5 parts per billion, with the monthly movt 0.2SDs above trend. I measure that trend as 0.004% a month, with a standard deviation of 0.051%. In 12m terms, concentrations were up 0.5% yoy, and the 12m deviation from trend was minus 0.1SD.
Nitrous Oxide: In September, atmospheric nitrous oxide was unchanged in mom terms at 331.1 parts per billion, which was 0.3SDs below trend. I measure that trend at minus 0.001% a month, with a standard deviation of 0.021%. In the 12m to September, concentrations were up 0.3% yoy, and the 12m deviation from trend was minus 0.1SD.
Sulphur Hexaflouride: In September, atmospheric sulphur hexaflouride rose 0.2% mom to 10 parts per trillion, which was 1.3SDs below trend. I measure that trend at an average minus 0.02% per month with a standard deviation of 0.07%. In the 12m to September, concentrations rose 3.7% yoy, and the 12m deviation from trend was minus 0.2SDs.
Observation: There is progress in nitrous oxide and sulphur hexaflouride where the trend is negative, and the 12m deviation from that trend is also negative. For methane, we're probably just about holding steady on a very slightly positive trend. For carbon dioxide, the growth trend is essentially uninterrupted.
But it is worthwhile knowing how dramatic, or placid, that CO2 growth trend actually is. Since 1960, concentrations of CO2 have risen from 317 parts per million to 411 parts per million, a rise of 30% over 59 years.

Global Temperatures: the Goddard Institute Monthlies
Surface Measurements: December's 'anomaly' from the 1951-1980 range +1.52 degrees, up from 1.34 in November, a monthly rise which was 1.1SDs above trend. On this count, the anomaly was the largest since March 2016. The current trend is for a monthly rise of 0.003 degrees with a standard deviation of 0.165. In the 12m to December, the deflection from that trend was +0.1SD.
Surface + Ocean Measurements: December's 'anomaly' was +1.11 degrees, significantly less dramatic than the surface measurements. The deflection was the highest since (only) March 2019. The current trend is less volatile than for surface measurements, with an average rise of 0.002 degrees and a standard deviation of 0.1206 degrees. In the 12m to December, the deflection from that trend was +0.1SD.

Observation: Goddard's data tells us that Dec's surface temperatures were sharply higher than trend - less so when you take ocean temperatures into account. Surface temperatures appear to be challenging the 2016 highs; surface and ocean together not so much.
Satellite Troposphere Temperatures
December's satellite data showed the troposphere's deflection up 0.01 degree mom, which was 0.1SD above trend. But the base of comparison was high, and the last four months have been the highest collection of anomalies since 2016. The upward trend since 2018 is marked, and the 12m to December 2019 showed the biggest jump vs trend since 2016. There is, however, some comfort in knowing since 2010 the average monthly rise in the anomaly has, in aggregate, been coming down.
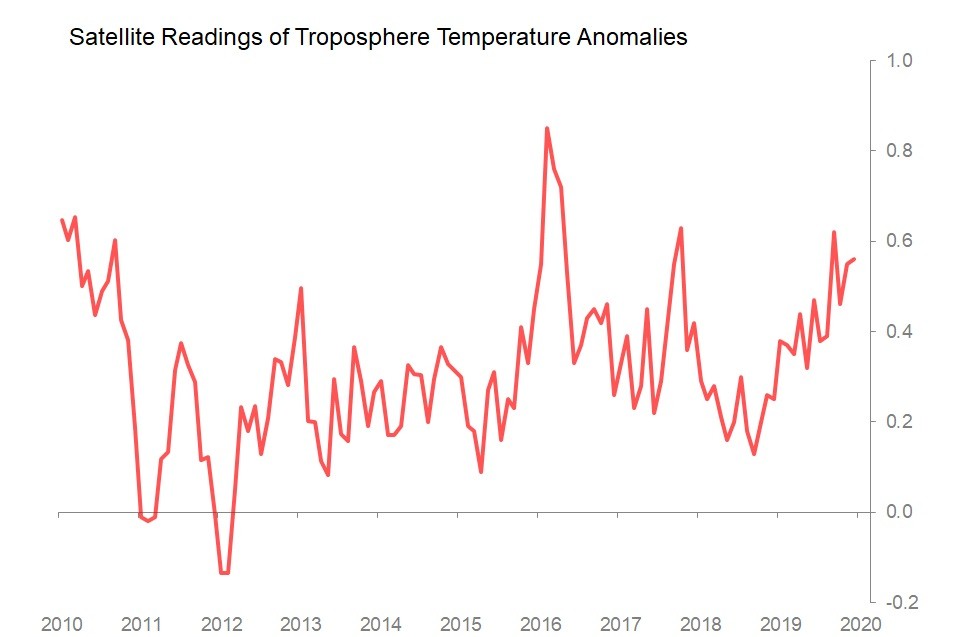
Observation: Both Goddard and UAH readings tell us that the last few months of 2019 had a marked uptick in global temperatures. It is not yet unprecedented, but if it continues, it may yet be.