
Nov 02•10 min read
A Nation of Fatness – How Fucked Are We?
.png)
A Nation of Fatness – How Fucked Are We?
Incredibly, unless we change our ways.
Let me explain why.
Public health organizations like the CDC use an anthropological measurement called BMI or Body Mass Index to determine the health of individuals within a population.
BMI uses an individual’s height and weight to estimate fatness.
This estimation is based off known population norms.
Basically, BMI compares your weight to the average person your height. If you are heavier than the average person, your BMI is higher. If you are lighter than the average person your height, your BMI decreases.
BMI does not take tissue quality into account. This means muscle mass, fat mass, bones and organs all "count" the same in determining your health.
Since BMI is based off normative data on body fatness, someone heavier than the average person their height, no matter the tissue (muscle, fat or bone), will be labelled as overweight or obese according to BMI.
According to the latest official statistics from the CDC, Adult obesity in 2017-2018 was 42.4%. That is equivalent to a BMI over 30 (for both men and women) or body fat percentage greater than 25% (men) and 32% (women).
According to the National Institute of Health (NIH), the prevalence of overweight or obesity in US Adults is 70.2 percent. Overweight is considered a BMI of 25 or greater or body fat percentage of ~20% for males, ~27% for females.
Based on these two classifications, it is evident that we are a nation of fatness.
However, it is imperative that we ask some pertinent questions about the data points above. Mainly, how reliable, and valid, is BMI at determining the health of an individual and therefore a population.
BMI is based off one key assumption: that someone who is “average” weight is healthy, and someone who is over “average” weight is unhealthy (over-fat).
Is this a safe assumption?
The question you need to ask is – is someone at a normal weight a good predictor of being normal fatness?
Or, is there a possibility that your weight is not as correlated to fatness as we thought?
If the answer to the latter question is yes, that means that BMI will either be underpredicting fatness or underpredicting fitness.
If BMI assumes that more people are healthier than they really are, the 70% number can increase to 80% or more.
If BMI assumes that more people are fatter than they really are, then at least less than 70% of the population overweight or obese.
.png)
Does BMI under predict Fitness?
Personal Trainers and Educators often turn their noses up at BMI.
This is because the phrase “BMI does not take muscle mass into account” is well rehearsed phrase amongst exercise enthusiasts and exercise professionals. It is the go-to excuse for anyone who is heavy but also possesses above-average muscle mass.
It is very true that muscle-mass is punished with BMI.
If you have more muscles than average, the BMI equation assumes that your added bulk, weather it is muscle or fat, is a certain average-percentage fat mass. The outcome is usually healthy-muscular people are labelled overweight.
For example, let’s look at the following individual:
Gender: male
Height: 6’3”
Weight: 238lbs
BMI = [(lbs * 703)/ height^2]
BMI = 29.7
That BMI is classified as overweight, and is actually borderline obese. In fact, if this individual were 2lbs heavier, their BMI would be 30, thus classifying this individual is obese.
It does not consider if that is a professional athlete with minimal body fat percentage or a sedentary, fat individual.
This example is actually Derrick Henry, professional football player and star running back of the Tennessee Titans.
The extra mass that Derrick Henry is carrying around is going to be predominantly muscle and therefore it is unlikely that this individual is 3 pounds short of actually being obese or maybe even over-fat.
Another example:
Gender: male
Height: 6’3”
Weight: 243lbs
BMI = [(lbs * 703)/ height^2]
BMI = 30.4
In fact, the well-known person listed above (data from 2018) yields a BMI of 30.4. Just into the “obese” category.
Those are the anthropometrics of one Donald J Trump, 45th president of the United States of America.
One probably doesn't even have to google them to know that Derrick Henry and Donald Trump have vastly different body types despite the nearly identical BMI.
As you can see, this measurement is fraught with problems.
In this case, BMI will count one (arguably) healthy athlete as overweight or borderline obese, the same as it would a clearly overweight, potentially obese individual.
Are cases like this the norm or the exception? Is it commonplace for BMI to under predict fitness? If so, the official CDC and NIH estimates of overweight and obesity percentages in this country are more likely predicting doomsday than truly accurate. That would be a good thing.
However, I doubt that is the case.
Why that isn’t the case. (Sorry).
There certainly are visible examples of individuals who are fit, but muscular, indicating BMI is over-estimating the number of fat people in the population.
Humans are generally visual learners with an image-based memory. This means it is easy for us to remember the example of a very muscular athlete being labelled obese as silly and inaccurate.
This might be a stretch, but us (humans, Americans?) have an innate desire to prove something scientific or governmental wrong.
In this case, we can say – “See! I told you us (Americans) being overweight as a nation isn’t such a big deal. We use BMI and BMI will tell you muscular people are fat! Just look at that picture. The experts are wrong.”
Unfortunately this one example does not tell the whole story.
It is the large portion of the population that is walking around at a relatively normal bodyweight, but with little muscle mass, that I believe is truly conflating the obesity endemic in the US.
I would hypothesize that BMI actually grossly under-predicts the true level of over-fatness in the United States right now.
The study that started my analysis of the true over-fatness of the country was a study comparing BMI and body fat percentage in Sri Lankan adults. It is not a perfect study, they use bioelectrical impedance for one. But they presented their data in way that makes it very easy to identify the potential flaw in the BMI assumption.
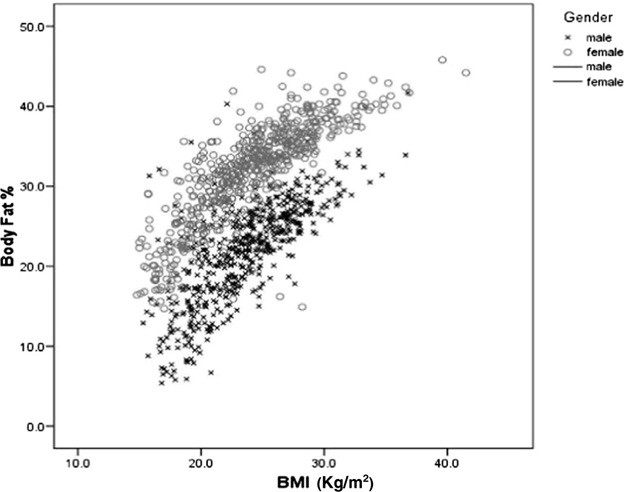
(From the article): Scatter plot of the relationship between Body Mass Index (BMI) and percentage of body fat (BF%) of Sri Lankan men (+) and women (o). Relationship between the percentage of body fat (BF %) and body mass index (BMI) of Sri Lankan (+) males and (o) females. The linear regression models: (BF% male = (BMI × 1.114) + (age × 0.139) – 9.662 and BF% female = (BMI × 0.918) + (age × 0.153) +3.819.Polynomial regression for non linearity: females (R2 = 0.70, SEE 3.4%, p < 0.000) males (R2 = 0.58, SEE 4.1%, p < 0.05).
What this study investigated was the relationship between BMI and body fat percentage.
Basically, they were investigating the correlation between these two metrics of "health".
Their results state a significant positive correlation between BMI and body fat percentage - as can be seen from the general clumped upwards pattern of points in the above image.
Their conclusion is important, as it shows that BMI is correlated with bodyfat percentage.
Someone with a higher BMI will most likely have a higher body fat percentage. This indicates the BMI can be used to assess the health of a population based on bodyfat.
But what the researchers did not discuss was the potential for underrepresented overweight and obese individuals if BMI is solely used to assess the health of a population.
I took the chart from the above study and simply broke it down into four quadrants.
The X axis divider (vertical) for the graph is the BMI value that corresponds with the threshold for being overweight (25) or obese (30).
The Y axis divider (horizontal) is the body fat percentage value corresponds with being overweight (M20%, F27%) or obese (M25%, F32%).
Following the division, we are left with 4 quadrants.
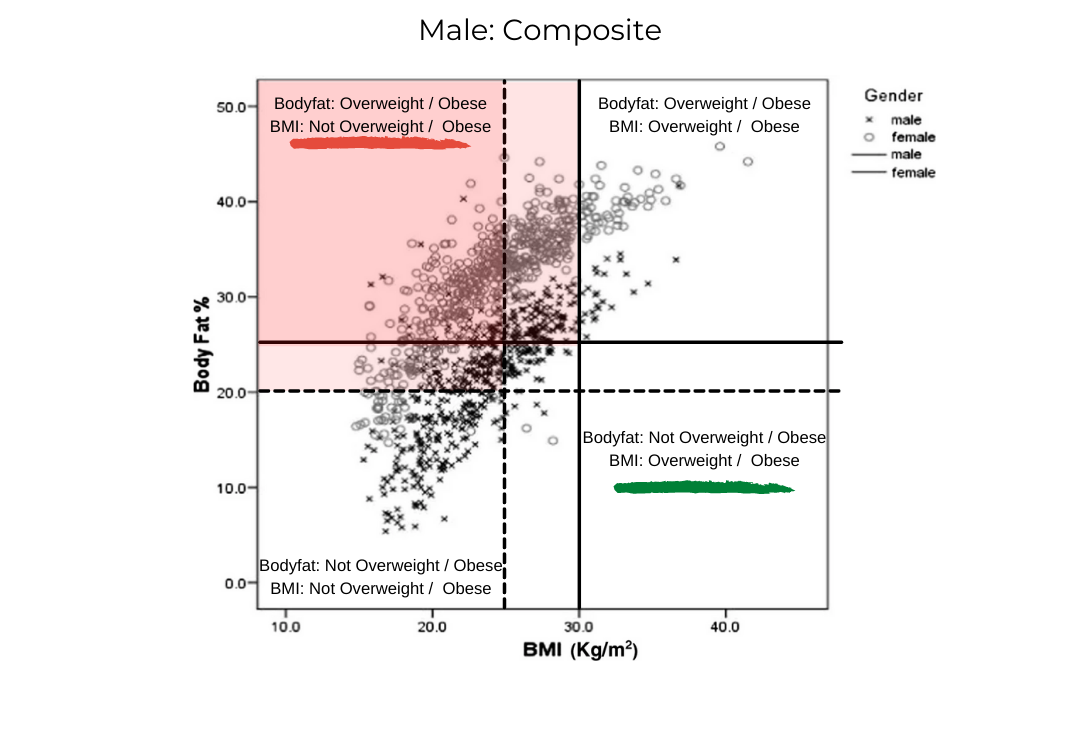
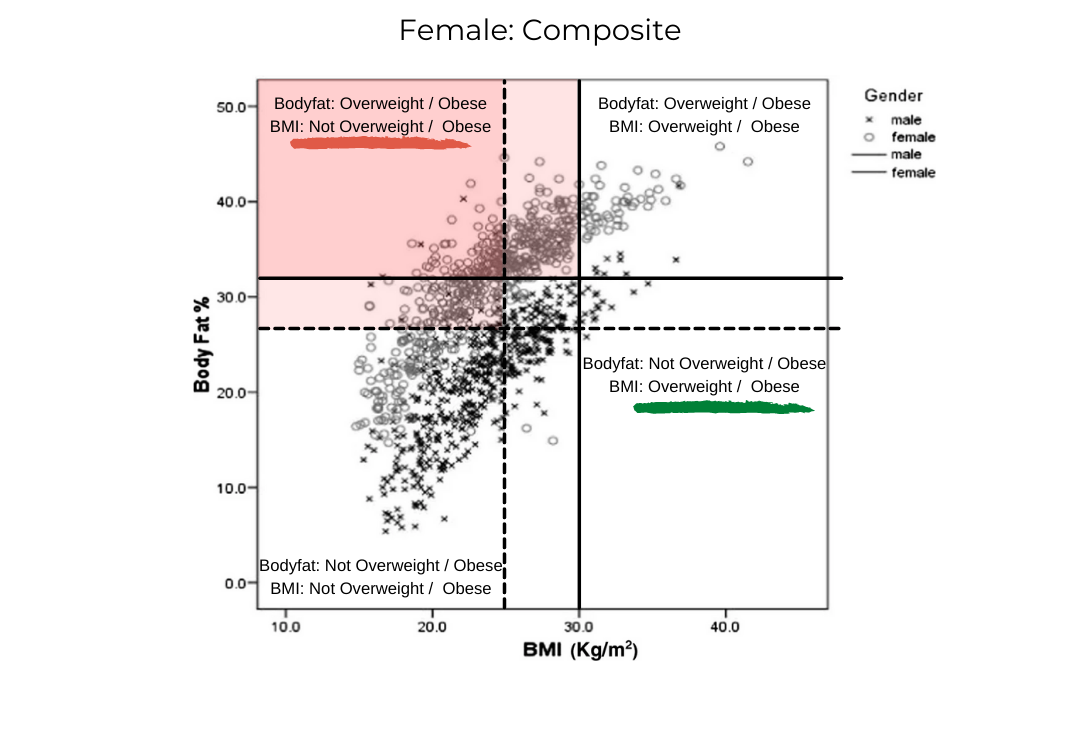
The dashed lines represent the threshold for being overweight.
The solid lines represent the threshold for being obese.
The middle square are the individuals who are overweight, not obese, as measured by both metrics (correctly).
If you are to the left of the solid vertical line, that means you are not obese by BMI standards.
If you are to the right of the solid the vertical line, you are obese by BMI standards.
If you are above the solid horizontal line, you are obese by body fat percentage.
If you are under the solid horizontal line, you are not obese by body fat percentage.
The dashed lines are added in to include those individuals who are also labelled as "overweight."
Remember:
Male: Overweight BMI > 25, BF > 20%; Obese BMI > 30, BF > 25%
Female: Overweight BMI > 25, BF > 25%; Obese BMI > 30, BF > 32%
Therefore, we have the upper right quadrant as those that are listed as overweight or obese by both metrics.
Bottom right is those whose BMI says they are overweight or obese, but their bodyfat actually lists them as not overweight or obese (the muscular group).
Bottom left is those whose BMI and body fat percentage are both under the level for being overweight or obese.
And upper left are the “underrepresented” folks – the individuals whose BMI lists them as NOT overweight or obese, but whose bodyfat percentage classifies them as overweight or obese.
This “underrepresented” category is troubling for two reasons.
One, it means there are people whose BMI might not pose them as “at-risk” but actually are and therefore should be advised to adjust their lifestyle accordingly.
And two, there are a lot more individuals in the upper left quadrant than the bottom right quadrant no matter which chart you look at.
This indicates there are more truly overweight or obese individuals who don’t look it (skinny fat) than there are muscular and healthy individuals who classify as fat according to BMI.
Based on the data from Sri Lanka, this isn’t a small percentage either.
Just eyeballing the data, it looks like BMI might miss an additional 20% of the population that should be labelled obese, and 40% that should be labelled overweight but are not due to BMI not taking body fat percentage into account.
For males, this would be anyone with a BMI under 25, but a bodyfat percentage over 20%. For females, this would be anyone with a BMI under 25, but a bodyfat percentage over 27%.
This same logic can be applied to obesity as well, with any male with a BMI under 30, but over 25%, and female with a BMI under 30, but over 32% being “underrepresented.”
What are the implications of this?
We are considerably fatty than we think.
People who think they are "fit" or "healthy" are not.
These individuals, while at a relatively normal body weight, possess a higher level of body fat.
Beyond essential levels, body fat is metabolically damaging.
Number of body fat cells is correlated to insulin resistance.
Elevated insulin resistance can cause a myriad of issues, resulting in metabolic disorder and metabolic diseases such as type II diabetes.
If people are unaware they are at risk, they most likely will not make any lifestyle changes until they are noticeably fat or ill.
At this point, it is very hard to reverse course.
Our health care system is not set up for this many people to be obese. It will be the largest strain on the entire system. Tough decisions will need to be made, programs will need to be unfunded, and medical care will become even more expensive... but tough to come by.
We need to get healthy... ASAP.