
Aug 13•8 min read
Bitcoin Is About to Go From Boring to “Boing”

If you feel like something’s been off in crypto recently, you’re not crazy.
Over the past few months, several earth-shattering events have hit this space, some good (the first Ripple ruling, the BlackRock ETF) and some bad (the SEC lawsuits, the Curve crisis).
Yet, Bitcoin (BTC) has barely budged. The usual rollercoaster of stomach-churning ups and downs has turned into a ride aboard one of those kiddie trains you find in malls.
In fact, BTC’s price swings have become so muted since the beginning of August that its volatility has nearly fallen below the average volatility of stocks, bonds, and gold combined.
Source: @DylanLeClair_
The reason for this is hard to pinpoint with any certainty: you can blame it on miners overwriting calls, institutions doing cash-and-carry trades, the Fed’s rate hikes, moon cycles, or some mix of the above.
But it doesn’t really matter much to me what the exact cause is. In my view, the market has been hypnotized into a deep sleep, and been falsely led to believe that this low volatility is a permanent state.
Meanwhile, all I see is how large and prolonged this deviation from the mean has become, and how optimal the risk-reward profile for a reversal is becoming before the end of the year.
Luckily, we can look back through history and see how this pattern of low volatility has played out before to give us an idea of what’s coming down the pipeline.
And of course, it wouldn’t be a proper J.J. essay if we didn’t tie in stubborn old King Dollar somehow. This week, he can give us some extra alpha to determine which direction BTC is headed once that volatility returns.
Which is important, because this ultra-low volatility is running on borrowed time.
BTC Is About to Go “Boing”
If you caught the latest episode of Alpha Bites, then you heard me make brief mention of this topic when I brought up BVOL, a chart referencing Bitcoin's historical volatility index, which I explained is now on the brink of hitting rock-bottom lows.
As we’ll see on the chart below, since 2016, BVOL has spent the majority of that time in the 40–100 range – its natural state.
That is until last August, when it suddenly fell off a cliff.
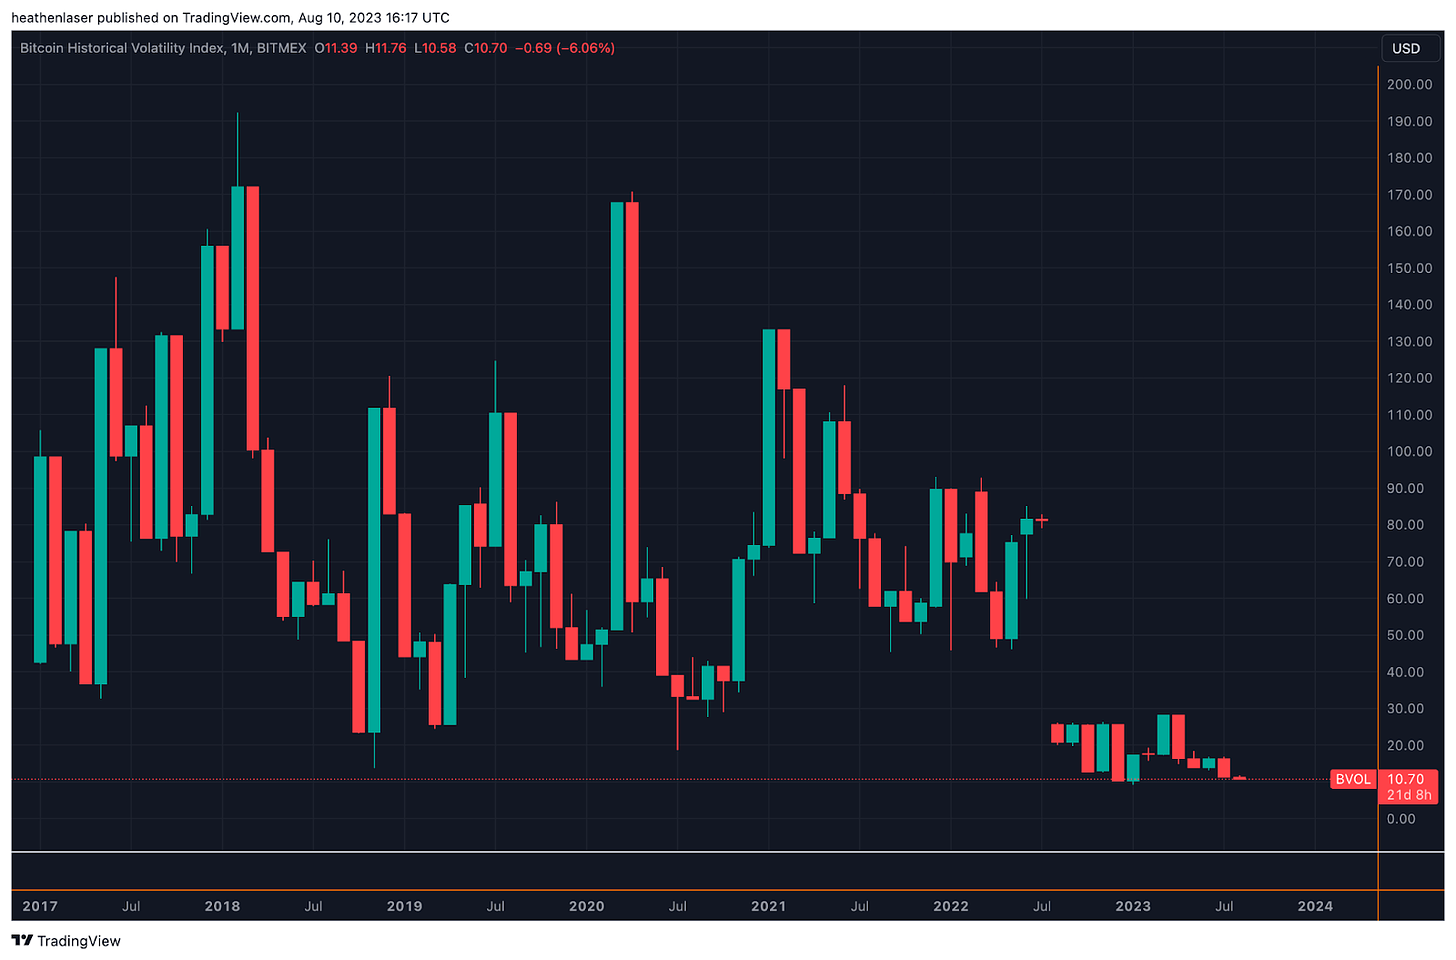
Over the past year, BVOL has failed to cross the 30-level. Not even the collapse of FTX nor news of BlackRock’s cannonball into crypto could coax it back into normal levels of volatility.
In his Blend essay last week, Ben Lilly took this theory a step further and overlaid BVOL (white line in the chart below) with Bitcoin’s price (orange line). That revealed an intriguing pattern which also seems to hint that volatility reversion is on its way.
As we’ll see below, there were only three times previous to now that volatility was this suppressed (marked by the vertical red lines) which led to wild swings in BTC (red boxes).
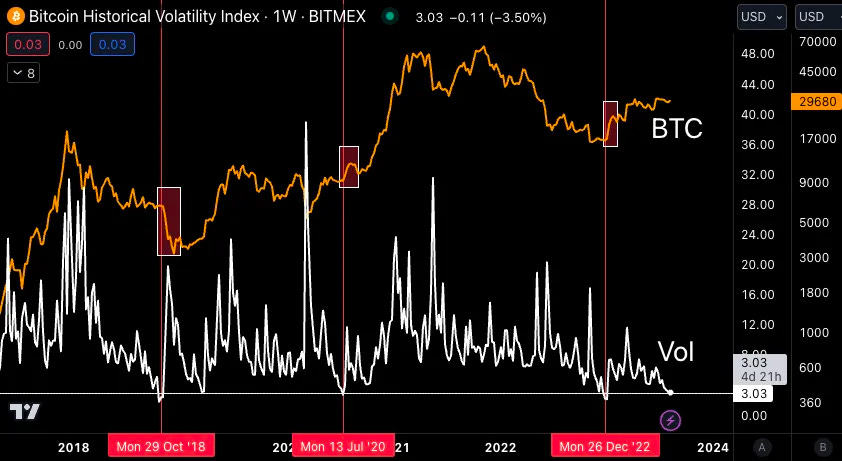
The first example came in the second half of 2018, when boredom in Bitcoin markets persisted for a few months. But eventually, the low-volatility trend broke and led to price crashing by over 50% in just over a month, falling from nearly $7,000 in late October to just above $3,000 by the end of that year.
The next was July 2020. Bitcoin was in zen mode and enjoying the summer as it consolidated just below $10,000, after a wild start to the year thanks to the COVID crash. As I’m sure you remember, it wasn’t long after that the $10,000 resistance level finally broke, and it was a mad dash towards all-time highs from there.
And then of course, there was December 2022, when the market was recovering from its post-FTX hangover. While chopping around $16,000, large amounts of speculative short interest came flooding in from a certain group of dilettantes who seemed convinced it was going to zero. Less than a month later, price erupted back over $20,000 and left heaps and heaps of bears liquidated in its wake.
Now, interestingly enough, low volatility isn’t the only thing these three periods have had in common in the lead up to their mega moves. There’s another leading indicator that signaled each of these moves were coming well before they manifested, and it’s on the verge of flashing us yet another directional signal right now.
To get to the heart of today’s essay, let’s take a deeper look below…
RSI: Really Scary Indicator
The common thread in each of these periods has been that our old friend the dollar, as represented by the U.S. Dollar Index (DXY), tipped off the big moves just before.
Each previous time Bitcoin has gone from “boring” to “boing” on the volatility scale, the dollar has been behind it. And we can tap into those signals by looking at its momentum as measured by its relative strength indicator, or RSI.
You might remember us discussing the importance of RSI as it relates to DXY’s daily chart back in June, just before the dollar sold off, BlackRock announced its ETF, and Bitcoin made its monstrous move from sub-$25,000 to over $30,000 in just under a week.
Following that post, the key RSI level of 50 on the daily once again held as resistance, and the dollar ended up flushing to year-to-date lows below 100 by mid-July.
Interestingly enough, however, it is back at that very same resistance point once again. The chart below shows DXY along with its simple moving averages (SMAs), with RSI being the purple line at the bottom.
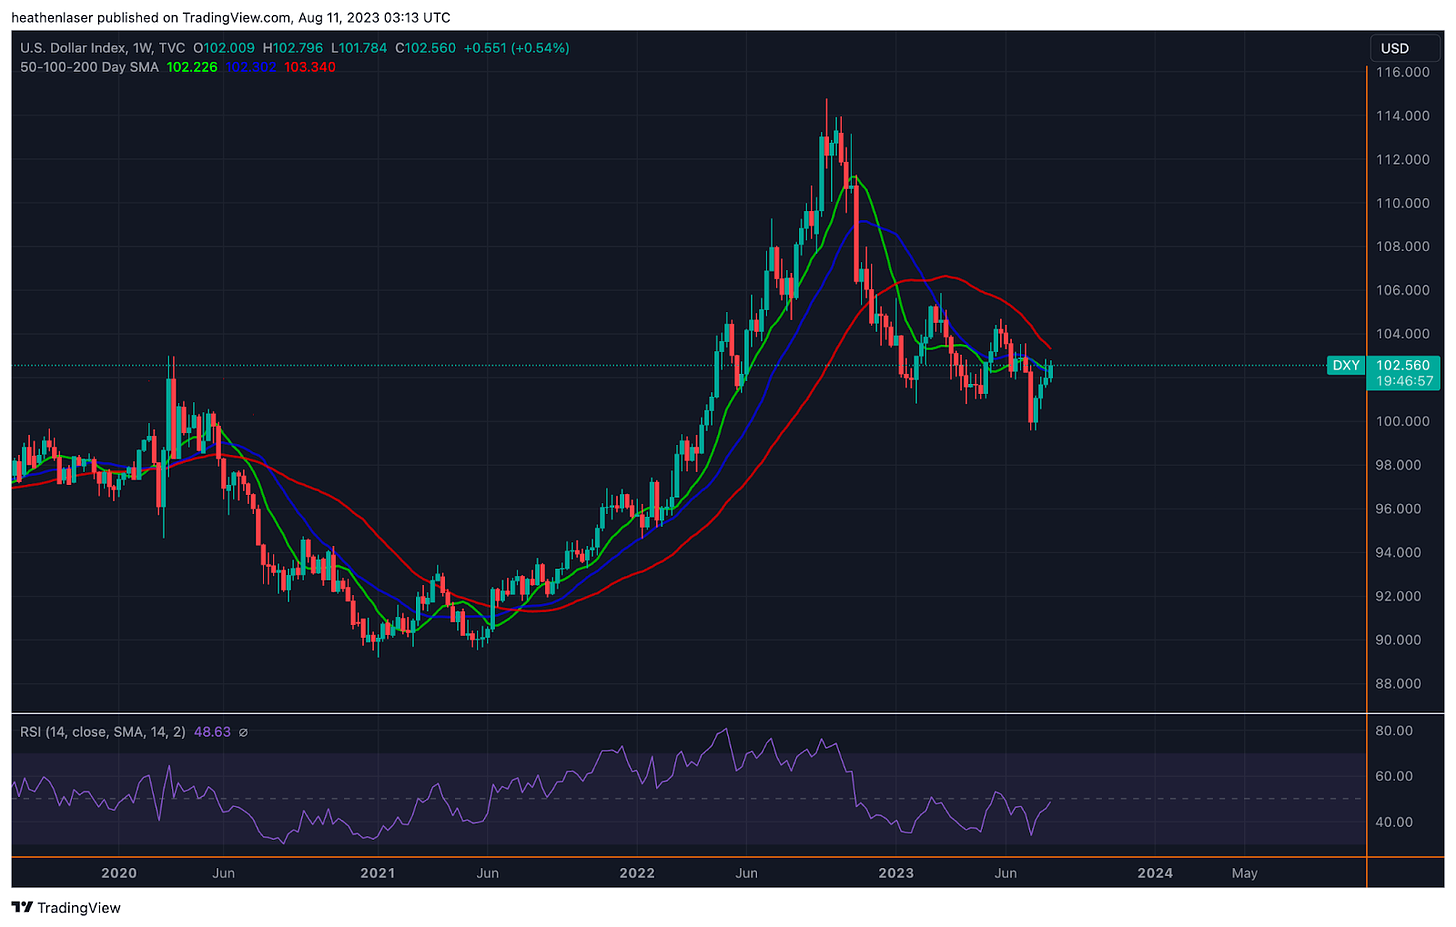
Worth noting this time is that there is a slight divergence as RSI is actually higher now (49) than it was in June (47), despite price being lower (102.60 at time of writing vs. 103.50 in June).
Now, typically this is a bearish signal. However, the dollar's renewed strength since July’s sell-off shouldn’t be so easily dismissed.
Note on the chart below how it has recently reclaimed its 50-day (green line) and 100-day (blue line) SMAs after multiple retests of each. This appears to be solidifying that it is indeed on the cusp of a fresh breakout, and a retest of the 200-day SMA (red line), which is currently resting at 103.38.
Should DXY break above 50-RSI and its 200-day SMA, it will be lights out for Bitcoin and crypto at large as I’d expect volatility to send us spiraling.
My downside areas of interest for Bitcoin become $24,600 (June low), $19,300 (March low), $15,300 (post-FTX low), and oblivion.
All bets will be off at that point, as the dollar milkshake will do what it does best – suck global markets dry of all their liquidity just before government officials step in and devalue it to new lows.
But believe it or not, the dollar’s daily chart is not the main focus of today’s essay.
DXY’s Line in the Sand
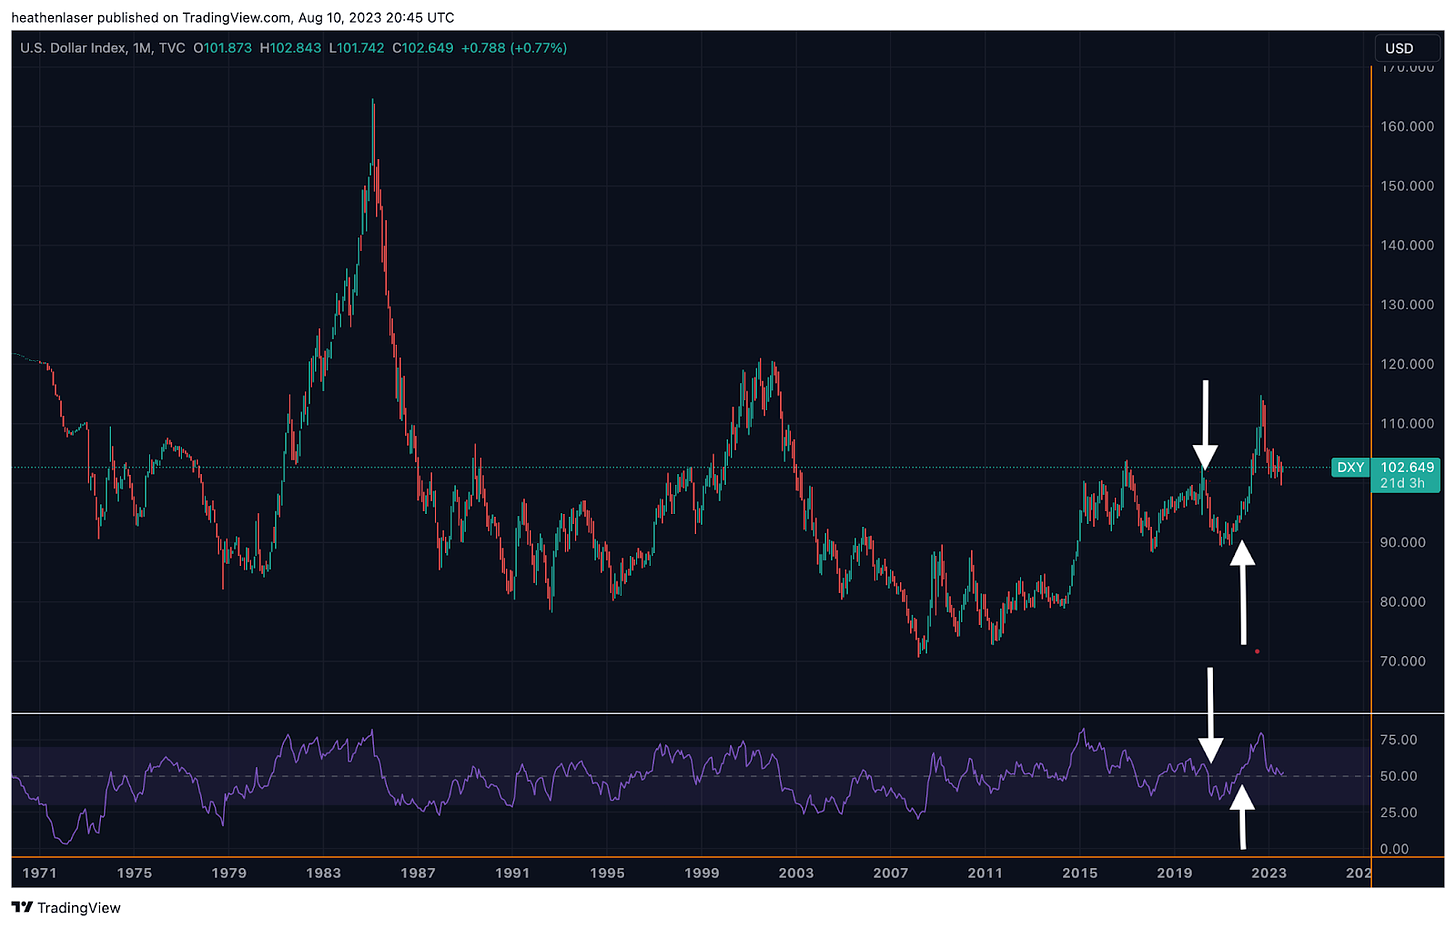
What I want to bring to your attention instead is the dollar’s monthly chart, specifically its RSI reading, which gives us a 100-foot view of DXY’s macro trend, and provides us insight to overlay with past periods of low BTC volatility.
As we see below, DXY’s RSI on the monthly is currently resting just above the ever-crucial 50 mark, an odd synchronicity as it battles with that level as resistance on the daily.
Especially when you consider that this 50-RSI level on the monthly chart is precisely where the dollar sat during the three previous instances of volatility eruptions Mr. Lilly shared last week.
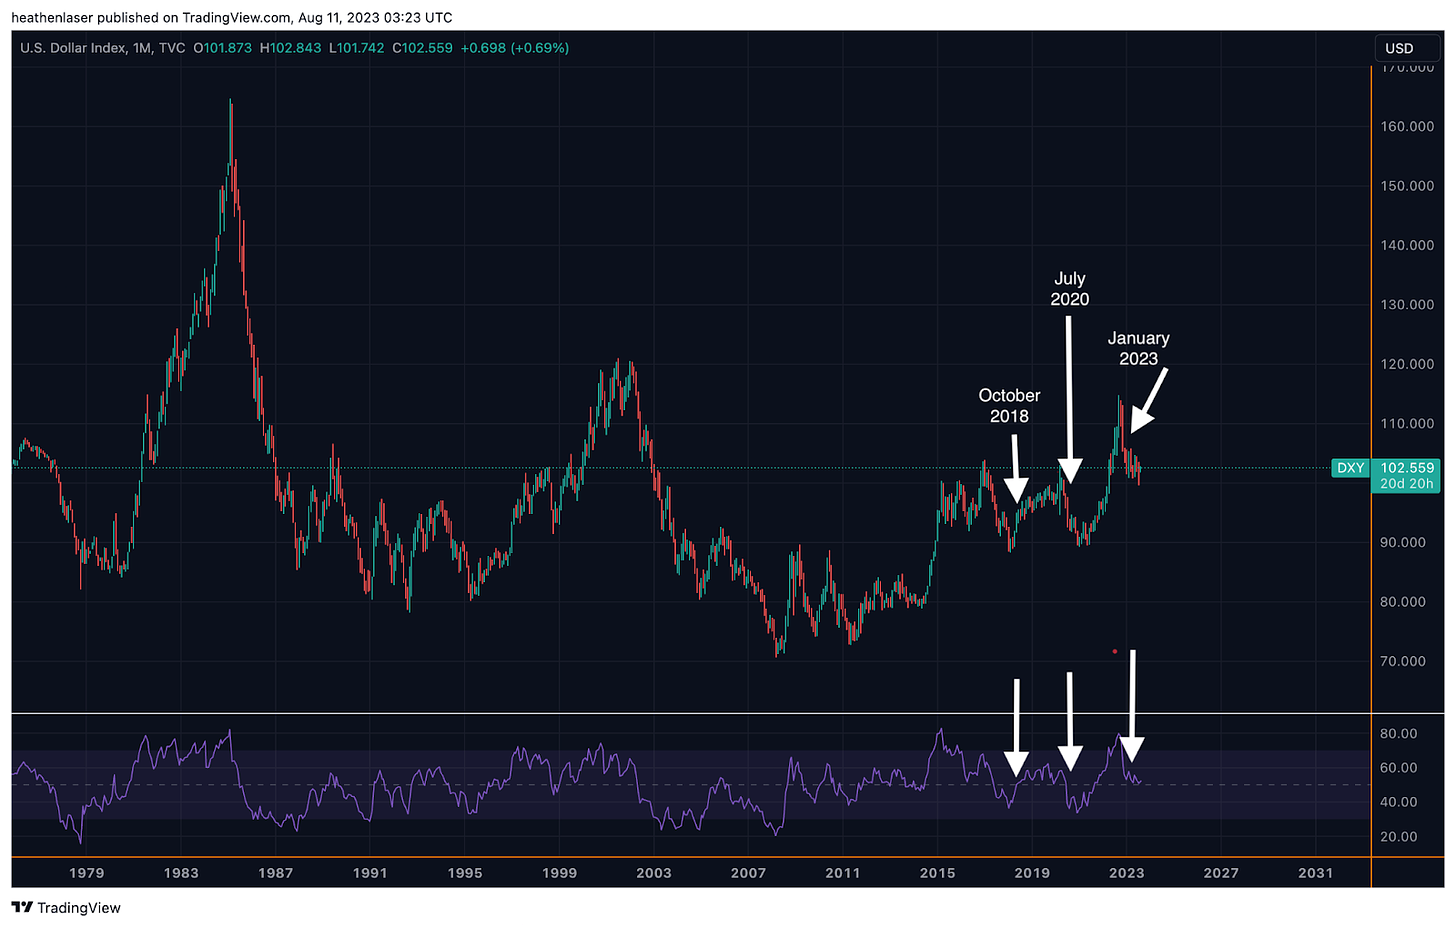
This 50-RSI mark on the monthly has been a pivotal line in the sand for directing the dollar’s macro trend dating all the way back to the early ’70s. And as we know, due to their inverse correlation, major moves from the dollar have ripple effects and set BTC’s macro trend for months to come.
Above 50-RSI, risk off: abandon your Bitcoins and buy back lower.
Below 50-RSI, risk on: flee the fiat rat trap at all costs before it hyperinflates to zero.
It really is that simple.
Just look at what we’ve witnessed since 2020. The dollar lost its 50-RSI trend on the monthly chart in July 2020 and then proceeded to drop by over 10% throughout the next eight months, plummeting from the high-90s into the 80s.
Then, once it reconquered 50-RSI on the monthly in October 2021 (not coincidentally just before Bitcoin topped out), that set the stage for its wild run from the mid-90s all the way up to a peak over 114 last September.
If one had bought BTC when DXY’s monthly RSI fell below 50 in July 2020, their cost basis would have been roughly $9,000.
If they then sold when DXY’s monthly RSI rose above 50 in October 2021, their average sale price would have been roughly $50,000.
455% in about 15 months ain't much, but it’s honest work.
I’d expect a similar ROI ahead should the dollar lose this trendline and enter into a formal macro bear market toward the end of year, especially if it's paired with a wave of spot ETF approvals.

Some may even say it has the makings of a 100-year storm.
But as with all things, patience and tact is a must.
Wait for signs of a proper DXY breakdown to act, lest you end up on the wrong side of a runaway dollar freight train.
Until next time.
Your friend,