
Jun 07•5 min read
Dazed and Confused

Catecholamines make you feel powerful and ready to fight.
They are hormones your body produces when the fight-or-flight response gets triggered.
These are incredibly powerful biological responses to stress. They can even give some humans superpowers like super strength. Like Danous Estenor from Florida, who lifted a Cadillac Seville off a man pinned underneath it.
But the aftereffects can be equally as intense. Once the hormones begin to wane, you can start vomiting and shaking, or faint.
The ill effects are likely even more damaging when you’re watching a trade position get wiped out. Much like what we saw yesterday in the market.
By dropping its lawsuits on Binance and Coinbase, the SEC triggered Crypto Twitter’s fight-or-flight response. Bitcoin’s (BTC) price dropped over 5% in two hours. Then, once the initial anger began to dissipate, price started to surge as many were still dizzy from the aftereffects of what just took place.
Cue the shakiness.
But now that we’ve had a bit of time to recover…let’s try to ignore the fear mongering from talking heads and check out the data and charts.
Broken Record
I’ll start off with the metric I’ve been hammering on for most of 2023: CVD spot.
As a reminder, CVD (cumulative volume delta) essentially measures whether buyers or sellers are currently the aggressor in the market.
If you sell an asset at the existing bids, you are the aggressor. And this shows up as a negative reading on CVD.
If you smash the asks by market buying, you are the aggressor and it results in a positive CVD reading.
Which means if CVD is trending upwards, more people are hitting the asks day-in, day-out.
Now, I look at spot CVD because this has been much more helpful than CVD for futures. To learn why, you can look back at older posts, but for this piece, you don’t necessarily need to understand why.
OK, so the chart is below. BTC’s price is on top, while CVD for spot is on the bottom. I added some red lines on the metric to help you see how much CVD spot is dictating trends. (I’ll explain the vertical green lines a little later.)
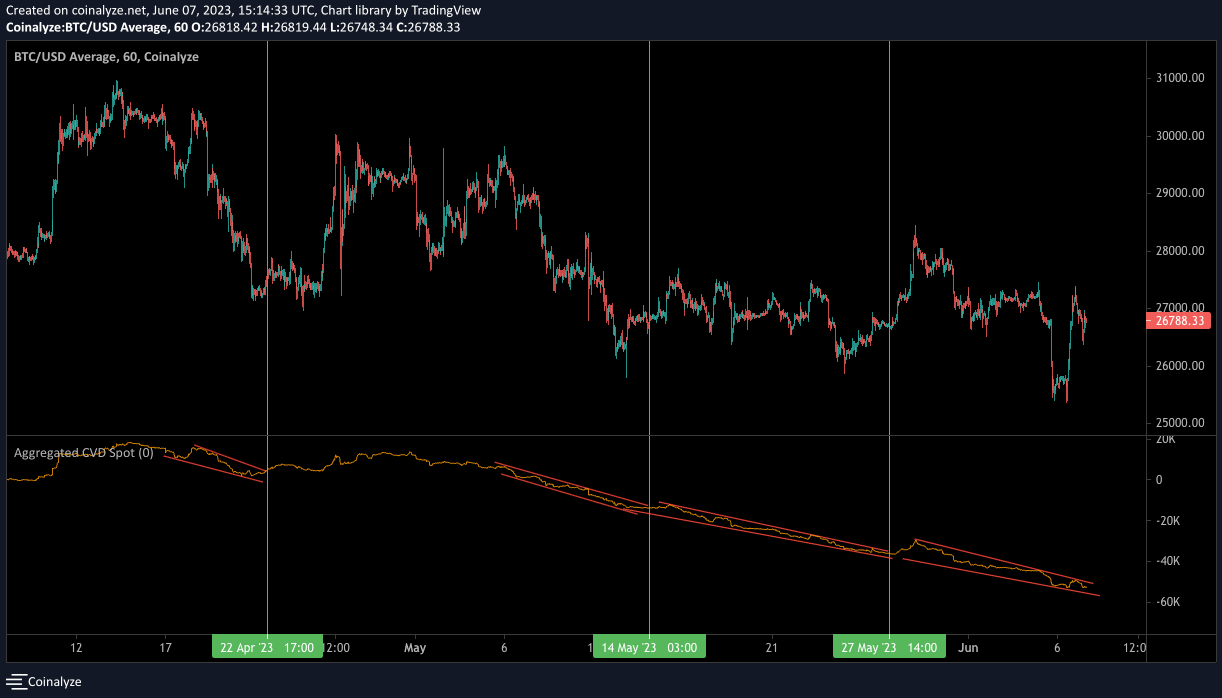
What we see now is this metric is running out of room within its current trend lines. When the trend breaks, price can run.
While there is no guarantee this will happen, knowing that the current trend is still intact despite this week’s whiplash is important. Meaning a break of this trend should result in a decent opportunity.
To determine just how big of a move up or down, I took those dates in green and dropped them into a liquidity pool chart.
With CVD spot currently trending down, it results in price seeking out low-leveraged liquidity to the downside. And when it changes direction, it is short-lived. And it’s why we can simply focus on higher-leverage areas to the upside, as it’s only a quick, short-lived move.
So if we want to think of targets to the upside, we can look at high-leverage liquidity pools.
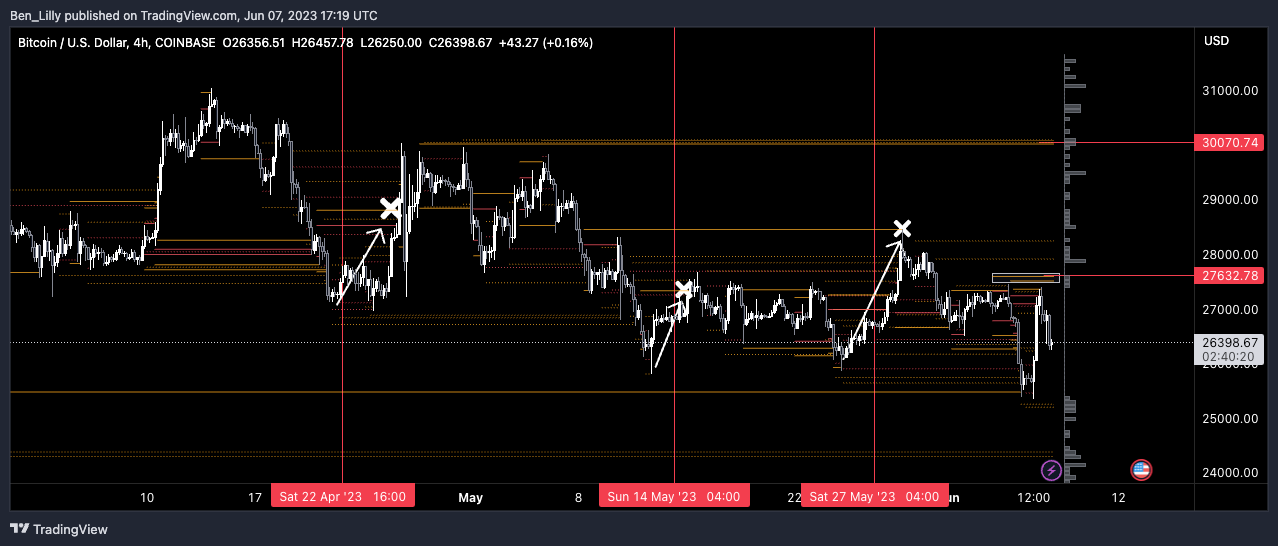
If we start by looking at the downside, we can see how price is taking out these pools (white arrows and X’s) just before those red vertical lines. These are those vertical lines I pulled from the chart you saw just prior.

We just took out a decent-sized pool to the downside. And after we see those hits, price seems to want to change directions to the upside.
If we change our filter and swap out low-leverage for high-leverage liquidity, we can look at what might be a target to the upside.
I went ahead and dropped that chart below while showing what has happened prior when we saw these trend breaks. Price seeks out these liquidity areas with consistency of late.
And moving forward, there are two areas of interest at $27,600 and $30,000. To get to $30,000, we will need to see a strong trend change in CVD spot.
Looking Ahead
Now, with these two charts in mind, if I had to lean one way or another, that $27,600 high-leverage pool to the upside looks prime for a tap next week. Meaning CVD spot looks primed for a relief from the overarching downward trend.
This would feed into the fact that volatility here does not seem ripe for change as I originally thought. Our friends from Paradigm went ahead and dropped some alpha on us that we look to share next week. It hints as to why I was so wrong about volatility being ripe for a breakout.
And if anything, I’m starting to view these end-of-quarter June contracts as nice timing for that low-leverage liquidity tap to the downside at around $24,000… That would indicate a return to the overarching pattern we’ve been seeing for CVD spot over the last couple months – down.
It might also pair up with my thesis that the 200-day moving average wants to get broken before we form new 2023 highs.
But before I lean too heavily into that thesis, I better ask a few follow-up questions to the options experts.
Stay tuned. We have an issue of The Blend coming out on Friday where I hit on one of our old indicators that helps us determine whether this is a bull market.
I also touch on why yield data is so important in a world where ETH is becoming more useful collateral. And I give a brief overview of legislative news that mattered, which Gary “Shades” Gensler tried to distract you from.
And don’t forget our most recent podcast episode, Alpha Bites. You can find it here.
Until next time…
Your Pulse on Crypto,
Ben Lilly