
Jan 30•9 min read
Bitcoin’s Big Bear Squeeze

Leverage giveth and leverage taketh away.
If we strip away all the narratives and fascinating storylines of the boom and bust that was crypto markets between 2021-2022, and look only at the data, that simple sentence explains it all.
For the uninitiated, leverage is the act of using your existing assets to buy more of the same assets on credit.
Leverage in markets is a double-edged sword, and when we view it microscopically, we can see that it is at times as good an indicator for market sentiment that there is.
For example, in late 2020-early 2021, the common market impulse was to “sell the rip” (slang for taking a short position) due to disbelief over Bitcoin (BTC) breaking above all-time highs.
This ended with bears in body bags, and BTC up over 32x between March 2020 and March 2021.
Conversely, in the first half of 2022, the common theme was traders “buying the dip” on leverage because they anticipated new all-time highs in 2022.
This ended with bulls castrated, as BTC crashed 75% below its 2021 all-time high.
Simply put, there is no more reliable sign of a macro trend change than those who overstayed their welcome in leveraged trades beginning to get forced out.
When this happens, it brings us into an era where we come closer to learning BTC’s true market value – free from artificial price suppression or support via paper derivatives.
The same way leverage artificially pumped the price in 2021, today we’ll examine how the opposite was true in 2022.
And though this week’s FOMC meeting could very likely cause some brutal price action into February, there is an overarching trend change underway which suggests that chaos could provide an excellent buying opportunity.
Let’s take a look…
Pressure Drop
If you’ve been following along with me since my early days here at JLabs, you may remember this essay where we unpacked the historical effects of open interest on Bitcoin’s price at length.
Recall that open interest measures the total number of open contracts, either long or short, in a given asset. By monitoring how it changes in relation to BTC’s price, we can piece together useful information about where BTC might be headed next.
Back in August, we surmised that Bitcoin’s price was being suppressed by excessive open short interest, which was continually getting larger as prices crashed.
Add to that the lack of interest from BTC spot buyers, and the price looked like a beach ball being held underwater.
We then concluded that once this pressure let up and spot buyers returned to the market, it would lead to Bitcoin violently surging upward.
Just like releasing a beach ball that was held underwater.
As it turned out, that piece was ahead of its time, as sure enough Bitcoin has finally escaped from Davy Jones’ Locker.
Below, we see how aggregate open interest (blue and red lines) falling in recent months has coincided with BTC’s price (green line) rising from the depths.
This shows us that the market is currently cleansing itself of stale short interest from 2022 which has overstayed its welcome.
This is a healthy development. Prices rising while open interest drops is a sign of an artificially suppressed price at long last rising towards equilibrium.

And while this open interest unwind is still in its early stages, there is a notable symmetry on this chart to be mindful of, which is the 2020 period.
That’s the last time we saw such a similar level of BTC price suppression via open interest (white arrows on the left, below), and it happened in the months prior to Bitcoin reaching an all-time high.
That open interest unwind led to the disbelief rally of late 2020 to early 2021. As short open interest collapsed and bears were left in shambles, BTC quickly skyrocketed to over $60,000 within months – a 23x gain in under a year.

Now, you may be wondering, how do we know the bulk of today’s unwinding open interest is positioned as net short?
Great question. We’ll find the answer below while reviewing a few more specific data points.
Squeezing the Lemons
Nowhere are the effects of misused leverage more visible than on Bybit, a crypto derivatives exchange.
Bybit is notorious for being the home of traders who, on aggregate, have low market IQ and high leverage – the data confirms this.
Their behavior gives us an insight into market sentiment among retail traders, which can be a useful contrarian indicator, as well as hint at whether open interest is mostly long or short.
Below, we see a USDT perp chart from Bybit. What it shows is that while BTC was still near $16,000 in early January, Bybit traders had over 70,000 BTC ($1.2 billion) worth of open interest (the white box) – the majority of which was short.
I guess they haven’t been reading Espresso.
We know this because once price (top graph) began to pump off of the bottom around January 10, open interest (bottom graph) on Bybit suffered a steep drop (indicated by the first up and down arrows).
This signals most traders were on the wrong side of the market, and their short positions got liquidated.
Liquidation is when an exchange auto-closes all of a trader’s positions at a loss to keep their account equity from going below $0, so the exchange doesn’t lose any money.
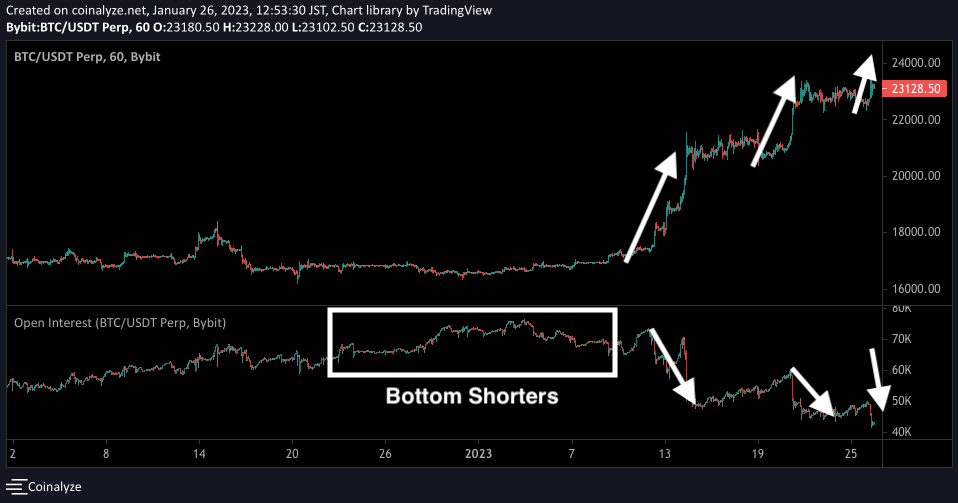
Source: Coinalyze
Looking further along that chart, we see that each time price has pumped since that breakout, traders became more anxious to “sell the top” on leverage, and added to their net short positions.
This has resulted in them becoming forced buyers at higher prices each time.
Bybit traders aren’t the only ones who’ve been subjected to this squeeze either. As my friend and fellow analyst Maartuun recently pointed out, there has now been over 23,000 Bitcoin ($530 million) force-liquidated over the past three weeks.
But retail activity is just one part of the picture. It’s important to look at institutional interest as well.
A portion of that 23,000 in liquidated Bitcoin is owed to a more prominent exchange you may remember from a previous article, the Chicago Mercantile Exchange (CME), recently turning bullish.
Call an Ambulance
Back in early December, we discussed the rise of Bitcoin shorts on the Chicago CME. In that essay, we covered data suggesting that CME traders were hurrying into short positions after the FTX crash had already happened.
At that time, many assumed FTX’s downfall would also mean the death of Bitcoin, and hurried into short positions as they desperately tried to profit off it. We deemed these institutional speculators “ambulance chasers” and explained the dangerous game they were playing.
What we found most notable was that it was clear then that CME’s “paper” derivative BTC short interest was suppressing Bitcoin’s price artificially.
Equally interesting was that at the same time, spot Bitcoin was in high demand and moving off of exchanges en masse.
A perfect recipe for the squeeze this January delivered.

We were able to decisively recognize this interest as short due to the steep backwardation which was taking place on the CME, and concluded that sooner or later, smart money market participants would capitalize on this inefficiency and squeeze out the ill-informed.
They did just that.
As of last week, the CME is back to being net long Bitcoin and their futures are in contango – which is the opposite of backwardation.
Now, CME traders are paying a premium to get long BTC, an encouraging signal that this rally can be sustained for longer as it reflects bullishness among institutional investors.
Just a Little Patience
So now to the question on everyone’s mind, how does this clearing of open interest end – and at what price will equilibrium be reached?
That is extremely difficult to say, as the market is a complex adaptive system.
However, what we do know is that on a long enough timeline, mean reversion is inevitable.
Sooner or later, prices will reach a point where they become too elevated, and that will lead to a liquidation cascade of the long open interest which has chased the pump in recent weeks.
This could come soon while BTC is still, in the $23,000 price range, or it might come later after a visit closer to $30,000.
It’s hard to say with certainty, but ideally, this future liquidation cascade will send prices crashing directly into major support levels, such as the 200-day moving average (red line below), which is currently at $19,618 and rising.
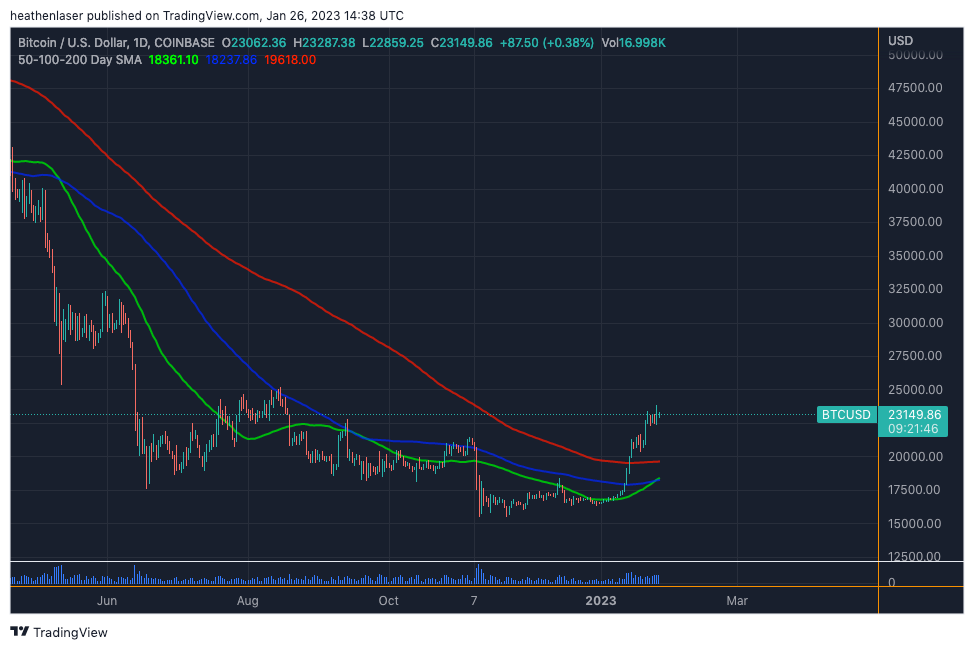
If it does, what we’d hope to see then is spot BTC buying power defend these levels, while more “ambulance chasing” shorts enter positions while price is at spot support.
This would provide our current rally with the additional fuel needed for another leg up.
Another catalyst to be mindful of is that the U.S. Dollar Index (DXY) appears overdue to backtest some of the moving averages it lost late last year, as you can see in the chart below.
As we discussed a few weeks back, the inverse correlation between DXY and BTC makes it likely that DXY will soon rise to backtest lost support levels, which will coincide with BTC falling to backtest its recently reconquered moving averages.
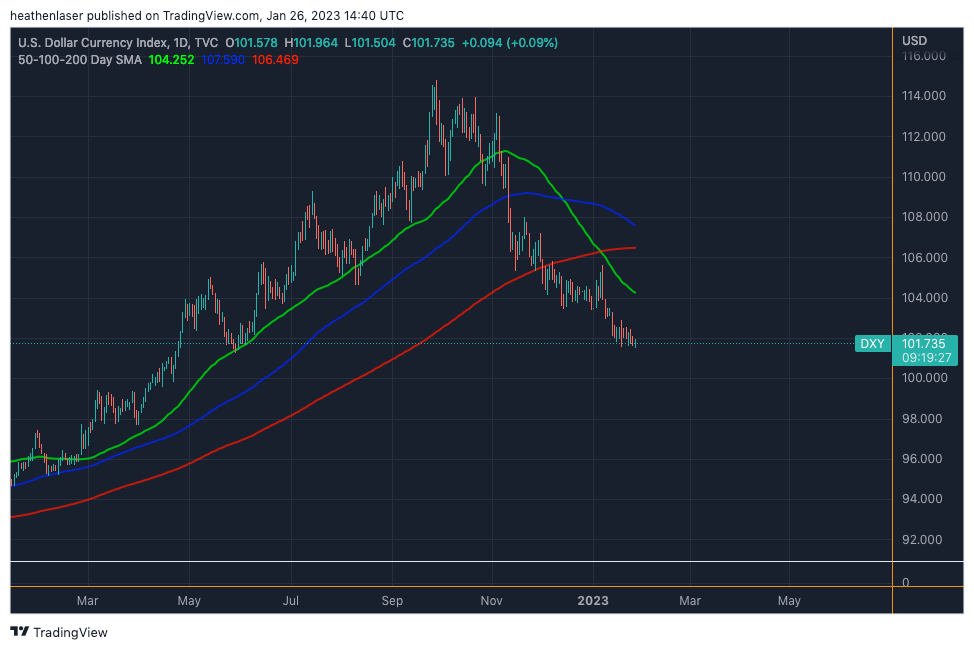
Crypto bulls should be cautious of such a backtest.
Trying to enter into a position in the middle of a squeeze is playing with fire.
The market is turbulent at present. So if you’ve been sidelined through the most recent rally, it’s best to practice patience.
But if you wait for an ideal opportunity like the one outlined above, it will allow for your risk/reward ratio to be tightly defined.
Unless 2023 is an anomaly to every other year of human existence, there will be times of both euphoria and despair in markets.
Especially in one like BTC’s where leverage trading is so prevalent.
What’s important is to pre-emptively war-game these potential scenarios and have plans of action mapped out in advance.
That’s my approach, at least.
What do you think?
Leave a comment below or let me know on Twitter @JLabsJanitor.
Your friend,
JJ