
Apr 15•14 min read
The Non-Narrative Plays

The latter half of 2023 will be marked with whatever narrative is fitting of the time.
This happened in 2020 and 2021 when the COVID money printer had gone full bore earlier that year. Its aftereffects were finally being felt in terms of inflation.
The result, every single trader, investor, and larper was singing the inflation hedge narrative of Bitcoin. It was why many believed Bitcoin was trending higher.
Fast forward a year and that didn’t play out so well. During the months from March to September of 2022, inflation sat at more than 8% each month… In that same timeframe, Bitcoin was down 50%.
Turned out that the inflation narrative didn’t work out well. So what happened? Well, many pundits began to flip the narrative and say Bitcoin was and is an early indicator on inflation.
I don’t buy it.
Which is why when Bitcoin goes on a tear in late-2023 and into 2024, whatever the narrative, I’m not a buyer of it.
In fact, you can take away any narrative, the macro sentiment, and everything else in between and focus on just one major thing - the halving. And as we will hit on later here, lots of price action is based upon supply fundamentals. The liquidity of supply or in Bitcoin’s case, new supply, is what we need to hone in on.
But to start the supply shock theme today, we start off with Ethereum. It had its Shanghai / Capella / Shapella or whatever else you want to call it, upgrade. While this upgrade looks to have minimal impact on its supply… There is another development taking place on Ethereum that you might want to watch in the months to come. It might create a supply shock that nobody sees coming. It’s the sort of thing that might make Ethereum a stronger play over Bitcoin in Q3 and Q4.
Then we will get into what I mentioned earlier… The non-narrative play for Bitcoin in late-2023 and into 2024. And why today’s price action is already playing into the non-narrative event.
Then finally we will dive into the FED’s recent FOMC minutes. What we found is that the FED looks to be caught in a bit of a lie. We hope you enjoy!
But first, a quick word from…

Ben Lilly here. As you know, we want to take Espresso to the next level. To do so, we’ve explored bringing sponsors into our newsletter, but in a way that first and foremost benefits you, our readers. To that end, we aim to share introductory offers that give you an opportunity to trial new services, tools, or exchanges.
We are excited to announce our first sponsor, the trading platform ByBit. For those who have been looking for a new exchange, consider checking them out.
They operate in 160 countries. They have more than 270 assets trading on spot and over 200 perpetual and quarterly futures contracts. They even offer options contracts and NFT trading.
Simply put, ByBit has a lot to offer any trader. And right now, they are offering a $10 welcome bonus if you open a new account and complete some introductory tasks. They also have additional ways for you to earn. So if you are looking for a new platform to trade on, consider ByBit today by clicking here. Also, if you simply want to support Espresso and the Jarvis Labs team, consider giving a click.

Superfluid Staking Is Coming to ETH
There is a constant wrestling match in my brain. It’s on the topic of monetary economics and ETH. This happens mostly because I reside at the middle of the curve. And my middle of the curve schtick is spending well over a decade trying to master the “social science” of economics.
So when I went full-time into crypto about six years ago, I thought I was ditching this wannabe “science background” of mine for something new. Turns out, those supply-and-demand curves are etched into my brain for good.
Which is why when it comes to analyzing ETH (and other tokens), I can’t help but view things with the old supply-and-demand lines moving about my mid-curve brain. And it’s why I apply monetary theory to ETH on a literal daily basis.
Eigen Layer is no exception here
For a quick background (whitepaper here), Eigen Layer looks to allow people to use staked ETH to secure other areas of the Ethereum ecosystem. The team sees the ability to re-stake staked ETH, known as superfluid staking, as a way to make staked ETH even more productive.
It’s an awesome idea, and our team is very excited to see this unfold. For one thing, it would reduce capital costs for users who want to take part in multiple areas of the ecosystem, since they don’t need to spin up additional servers or stake additional ETH.
Further, it also helps projects looking to bootstrap their security using Ethereum’s strong consensus layer. New projects tend to overspend on security in the early days, over-rewarding validators with tokens for a network that doesn’t need such high security spends. This creates an excess of supply in the market that becomes burdensome for projects to overcome.
So it could be a very powerful solution for the market. But when it comes to the monetary economic impacts, I was torn.
The main benefit of implementing superfluid staking is that essentially, there is now more ETH in the market. Instead of a user having to buy more ETH to stake to a new project, they can now just reuse their current staked ETH.
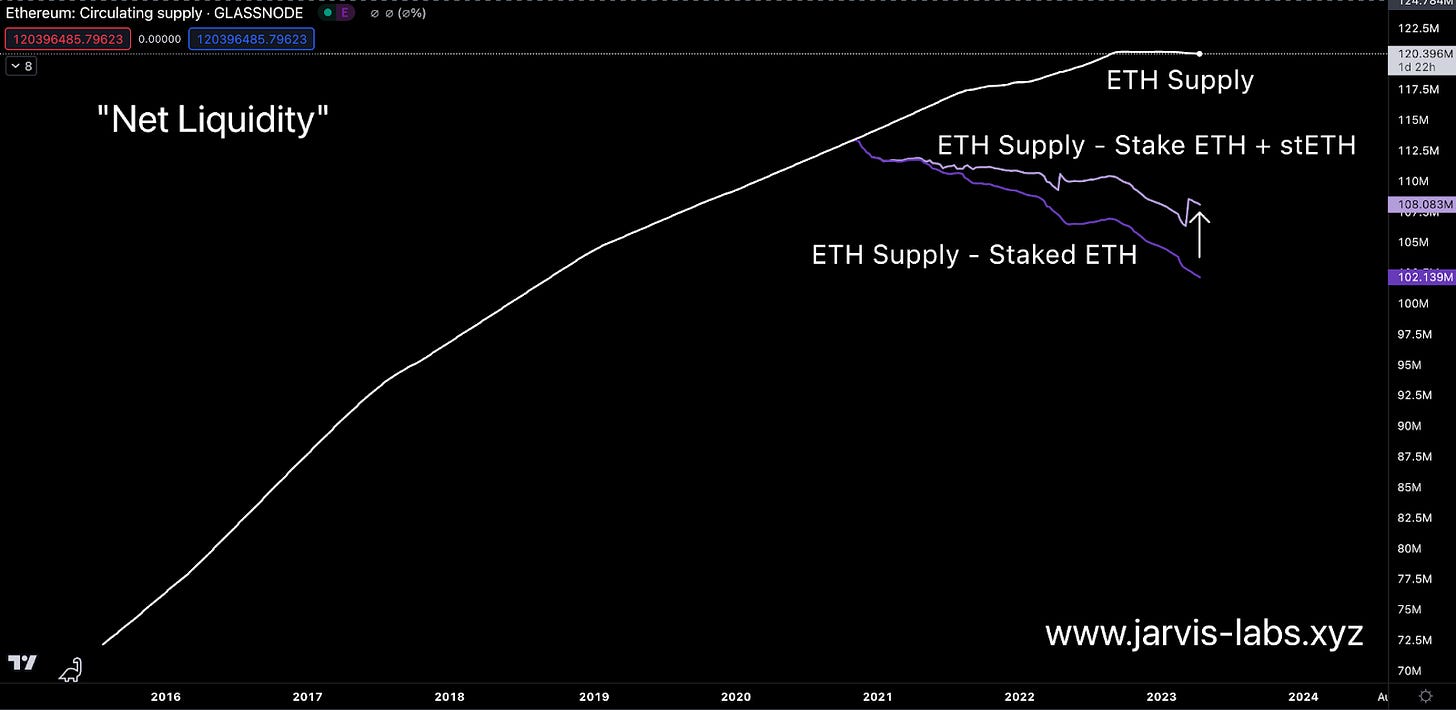
This quick sequence of charts might help cement this thought here.
In the first chart below, the white line represents ETH supply. The purple line below this supply line represents the supply of ETH minus staked ETH. It is a low-level way of viewing “net liquidity.” (I didn’t want to introduce this concept yet, as we are creating a new way to view liquidity and supply, but it’s not quite ready. So screw it. Hopefully, whoever runs with this and beats me to creating this metric at least gives me a sliver of credit.)

The issue with this line of thinking is that because Lido, Frax, Rocket Pool, and others offer liquid staking derivatives (LSDs), they essentially made staked ETH liquid again. Meaning this view of net liquidity is inherently flawed from the start.
Which is why in the chart below, I went ahead and added the supply of Lido’s LSD, stETH, back into the ETH net liquidity line. (I could also factor in total value locked (TVL) of ETH, but the data is a bit flawed from what I used on TradingView – again, why we have our own version coming soon.)
Anyways, as you can see below, net liquidity is significantly higher. And if we factored in Rocket Pool’s rETH and Frax’s frxETH, it would be even greater.
Which is to say, on the surface Eigen Layer feels like it would end up making staked ETH even more liquid, since it allows them to be re-used.
But as everyone knows, the mid-curve brain agonizes over the simplest of things. And this brings me to the Mid-Curve Take of the Week.
What Eigen Layer will actually do is cause the supply of ETH to become less liquid than before. Because instead of staking ETH on LSDs, users will restake it using Eigen Layer.Meaning Eigen Layer will cause net liquidity to fall.
And less supply in the market translates to stronger price trends higher.
Eigen Layer’s solution will likely fly under the radar of the crypto market, but once it goes into effect, we can expect to see this translate to stronger fundamentals for price to rally harder. We look forward to tracking the usage of Eigen Layer once it gains traction.
But keep in mind, just as JJ mentioned recently, ETH’s fate is still determined by the market’s king: BTC. Where BTC goes, ETH will go.
These fundamentals act more like a “beta” play to BTC during price rallies. Meaning when BTC’s next big trend unfolds, ETH’s fundamentals will present a strong case for it to outperform BTC.
And we may already know what that big trend is…
Bitcoin Is Trading Like Oil
We are just over one year away from Bitcoin’s next halving.
Each halving results in less new bitcoin entering circulation. It’s a supply shock to the network. And if we go back to our oil analogy from last week, this would be similar to less oil being pumped out of the ground.
When we see this chatter from oil producers, prices rise in anticipation. Typically, there is a price movement on the news… Then a calming of markets… Followed by prices slowly rising higher over a longer term.
Here’s a quick example. This is world oil supply on an annual basis. Note that around the year 1999, oil supply dropped.
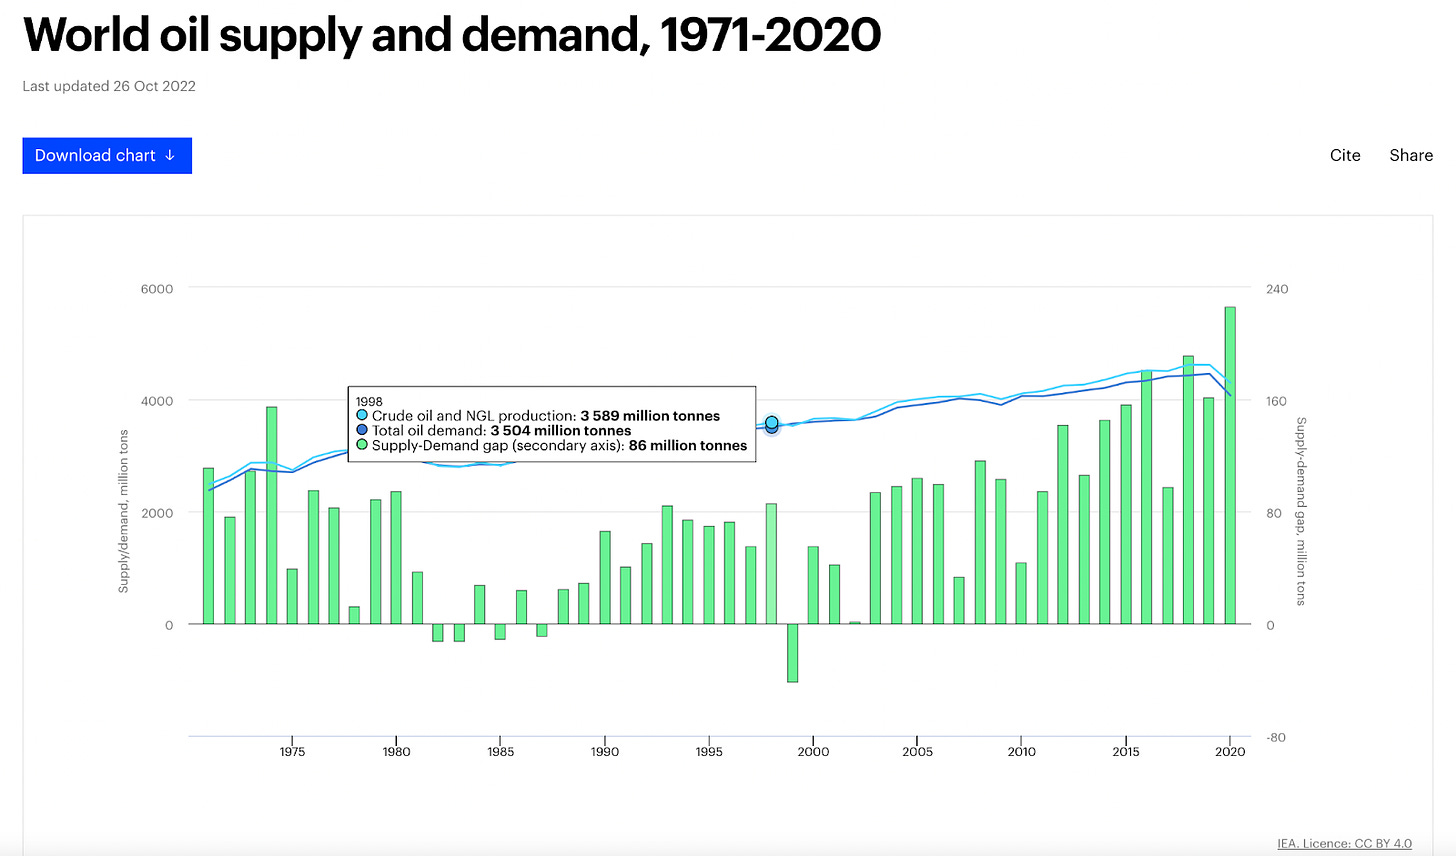
This was due to global agreements to cut production that were announced in March and June of 1998. What’s interesting is that we saw price action before these cuts went into effect.
I went ahead and dropped a vertical red line on those time periods in the chart below, which shows prices for light crude oil futures. Note the price action around that time. There were two quick jumps of more than 20% in a week in anticipation of the cuts taking place.
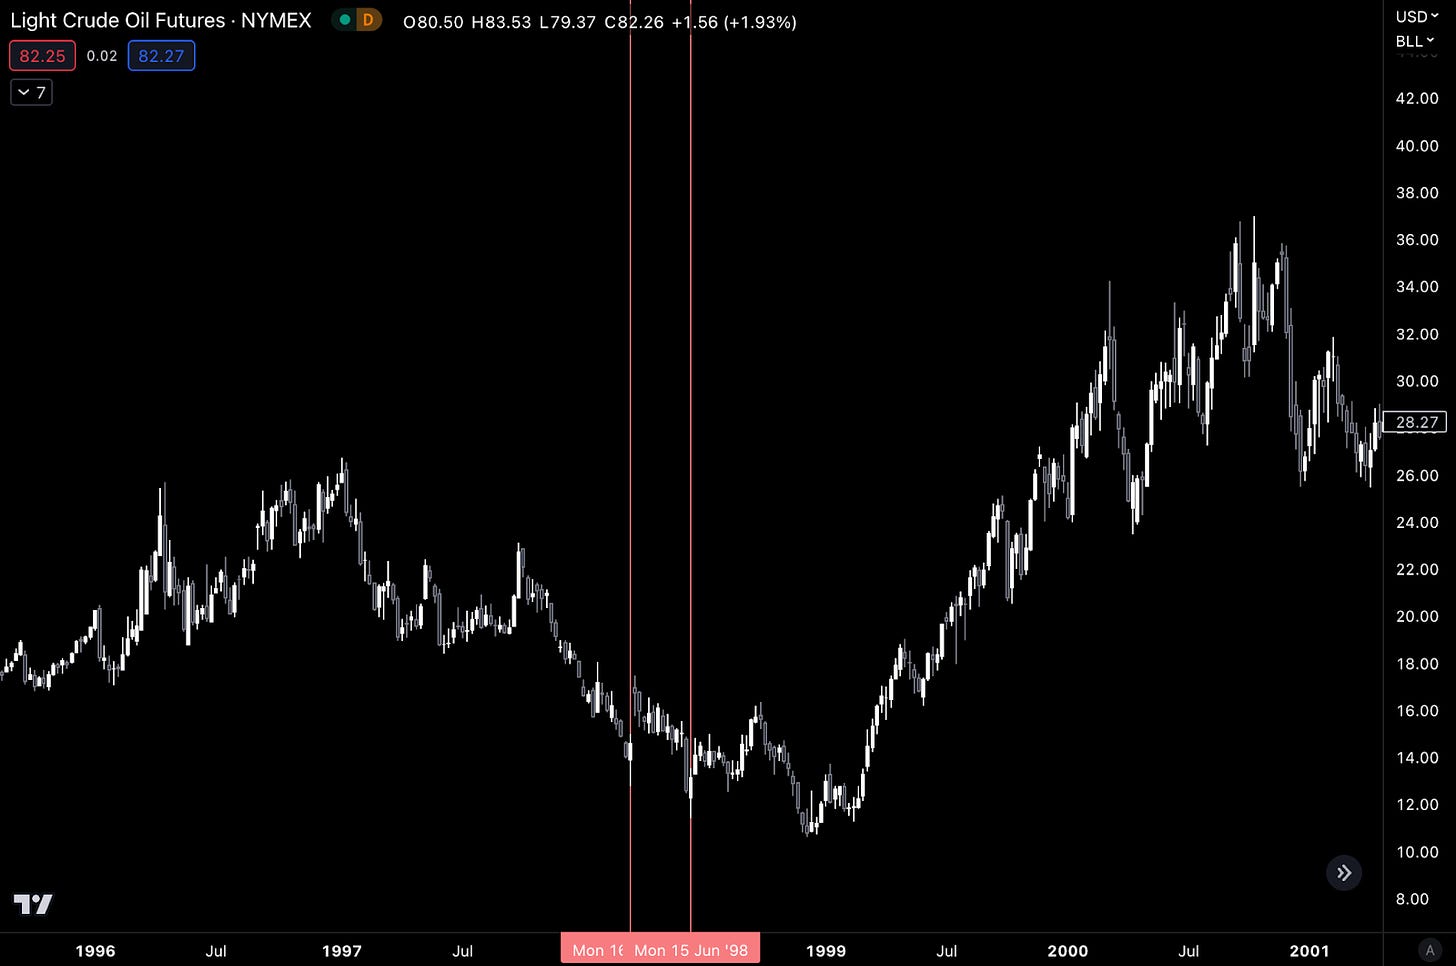
But prices continued to sag until the start of 1999. That’s because shifts in supply like this take time to be reflected in global market prices.
There’s a lag between cuts being made and price reacting, because supply is still present in the market. But once available supply in the market begins to noticeably shrink, price responds.
In 1999 and 2000, once the supply cuts kicked in, oil prices rallied more than 200%.
This is what takes place with bitcoin. The main difference is that its production cuts are programmed into its code. There is no need for a press release. The market knows it’s coming and can essentially front-run it.
We can see this in a chart we shared with clients a couple weeks ago. It shows cyclical bottoms relative to each halving.
Price bottoms out between 13-18 months prior to each event. We are 12 months away from the next halving now, meaning based on this history, that’s why BTC prices have been moving higher recently..
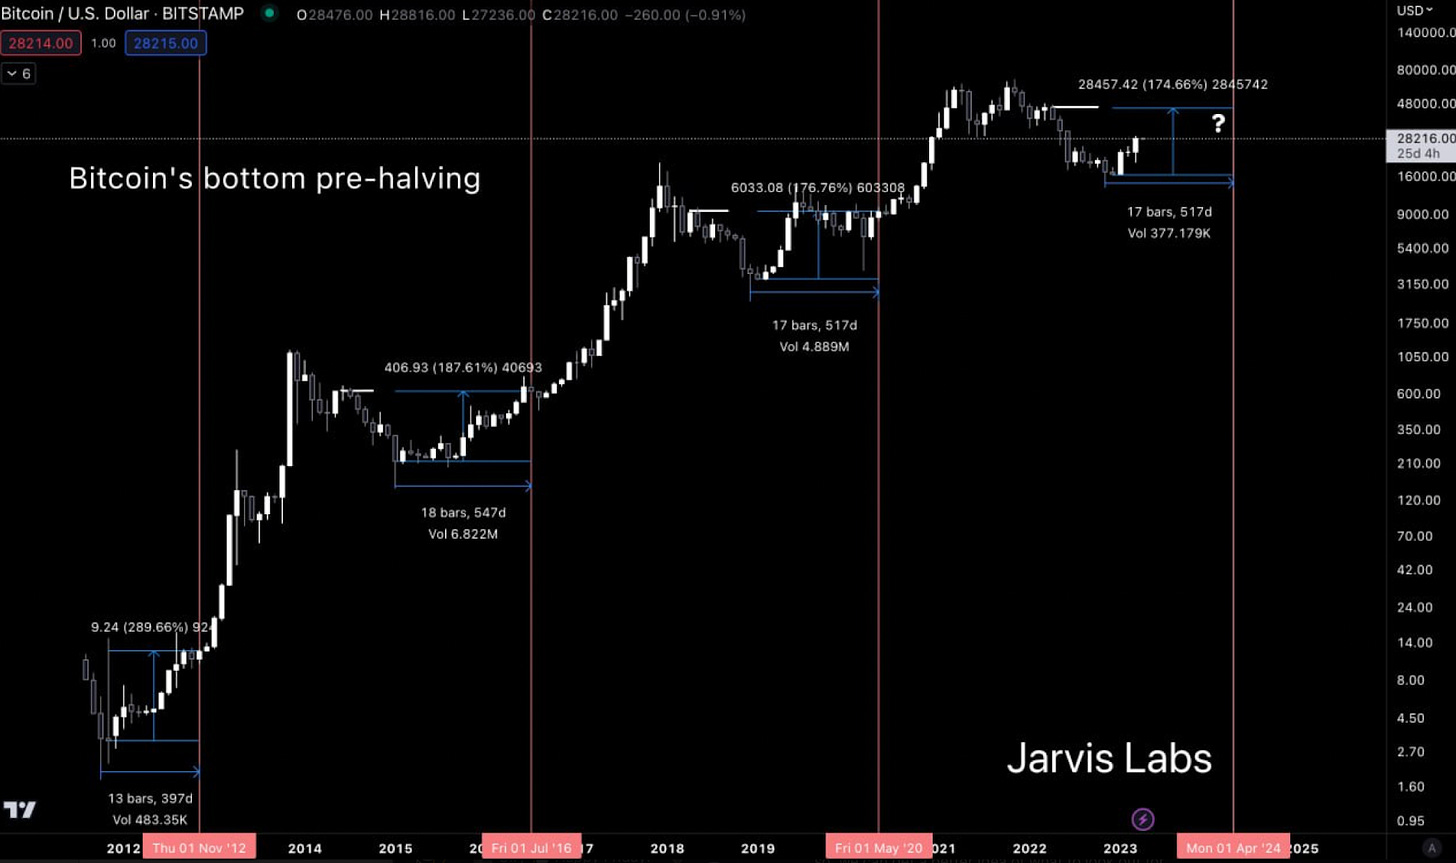
The other important part to note here is that there tends to be a cooling-off period that takes place between the bottom and the halving event… And it’s this cooling-off period that presents some of the best opportunities historically.
In the months to follow, we are watching the market for signals that this cooling-off period is near. A few indicators you can watch are open interest and funding rates for Bitcoin.
You can expect to hear more on this in the weeks to come as Benjamin and myself – The Bens – will bring back the market updates in Espresso. We look to publish these twice a week, as this market is one you want to remain very active in for the next 18-plus months. Stay tuned.
Why Buffett Hasn’t Made a Move Into Banks Yet
Warren Buffett recently revealed in a CNBC interview that he does not care about macroeconomic data points. He even believes it’s a waste of time to hire macro advisors to tell you what is going to happen to the economy, and that the U.S. economy is expected to notch a 0.1% GDP growth rate for 2023. .
There is so much truth to his view. When it comes to projections of GDP, inflation, or employment rates, they are rarely correct.
We can easily check ourselves. Go ahead and Google the U.S. GDP forecast for any year. Then, using the “tools” option, adjust the time frame to show the predictions that were published one to two years before the target year.
I searched for 2022 forecasts and looked at results from Q4 of 2021. That’s a small-enough time horizon that it should make predicting relatively simple.
Goldman Sachs expected a strong 2022, forecasting GDP to be 4.4%. Trading Economics put the annual figure at 2.2%. This hits on Buffett’s point. Economic forecasting like this is rather useless. Much of it is due to lag and similar data-gathering issues.
Which means instead of worrying so much about where the economy might be going, it’s sometimes better to just see what those who pull the economic levers are thinking.
And that’s what we got to see with last week’s release of the Federal Reserve’s (FED) March FOMC meeting minutes.
If you’re itching to give it a good Sunday look-over, you can find it here. For the rest of us, I’ll give a quick breakdown on what was in it.
Because this was a quarterly release, we got to see what the governors are thinking in terms of setting rates. They do this via a dot plot where each dot represents one governor. And the overall picture of the dots’ placement gives us a clue into their thoughts of whether the economy is in trouble (lower dots) or it is running too hot (higher dots).
Right now, the majority of governors are still looking at setting rates between 5-5.25% in 2023. This is higher than the current 4.75-5% figure. You can see this in the chart on the right-hand side below. The chart on the left is the prior dot plot from December.
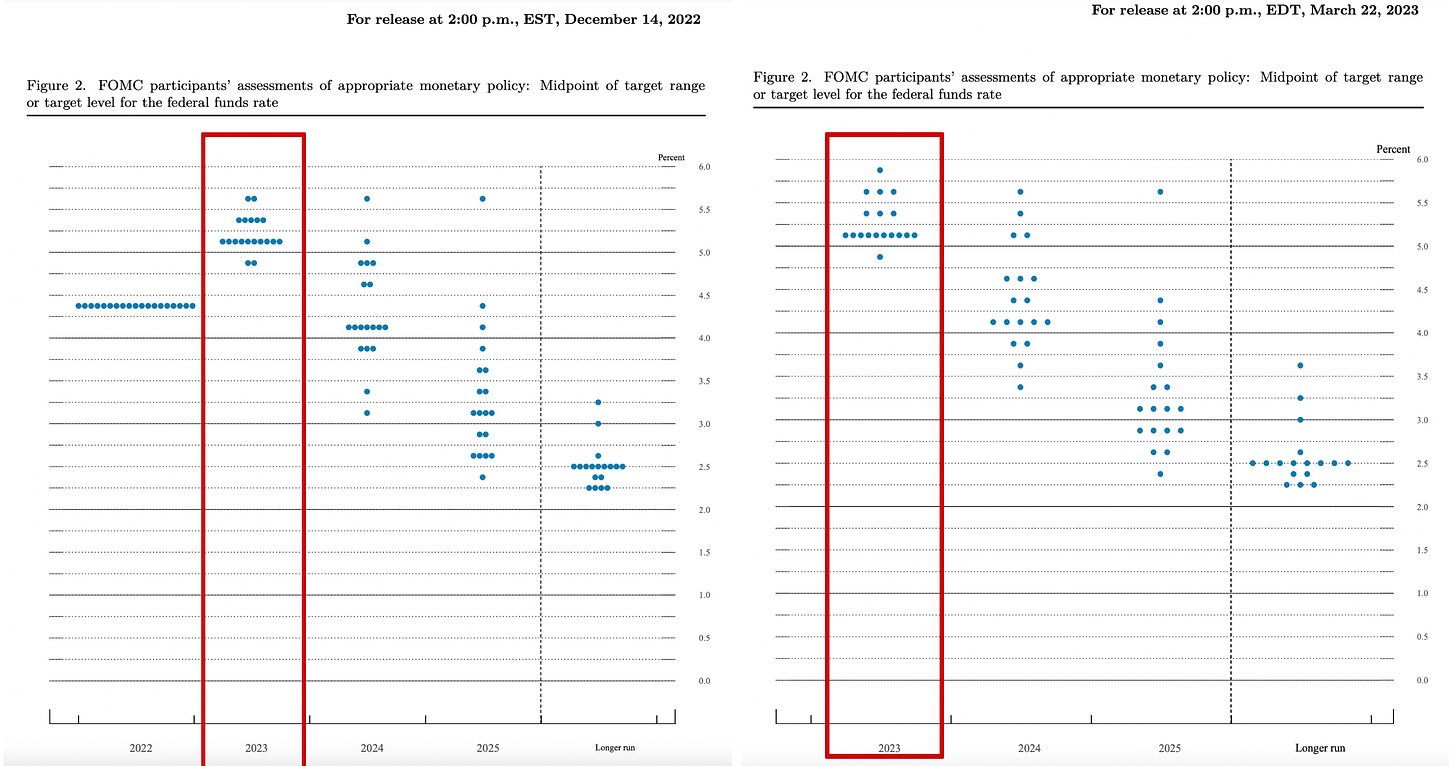
This helps us see that no change really took place in their mindset even after the spate of bank failures last month.
This implies to me that the FED is now beginning to save face. They know markets are getting overly tight. And want to act like everything is just fine.
In the March minutes, you can see this written out:
Some participants observed that downside risks to growth and upside risks to unemployment had increased because of the risk that banking-sector developments could lead to further tightening of credit conditions and weigh on economic activity.
This indicates FED members are worried that their policy is now becoming “entrenched” in the economy. That would lead to smaller banks tightening their credit offerings. It’s in part why they expect a “mild” recession later this year.
But here’s where it gets interesting. This is a snippet of their press statement:
Recent indicators point to modest growth in spending and production. Job gains have picked up in recent months and are running at a robust pace; the unemployment rate has remained low. Inflation remains elevated.
That’s the first paragraph. Note how positive everything seems. Then comes another hint of positivity, followed by the negative in italics (emphasis added):
The U.S. banking system is sound and resilient. Recent developments are likely to result in tighter credit conditions for households and businesses and to weigh on economic activity, hiring, and inflation. The extent of these effects is uncertain.
We call this a classic shit sandwich. They packaged positivity ahead of negativity before following it up with lots more fluffy buns.
In the minutes, they spend pages discussing this concern, but decide to conclude with a bold-faced lie that the banking system is strong.
Coming back to our prophet from Omaha, Mr. Buffett… He was at the White House last month. He talked to the administration about investments in the banking sector. But we have yet to see Mr. Buffett make a move in this area.
The FED minutes give us a clue as to why…
There will be continued credit contraction. And until the FED decides to change that dot plot some more, there’s no reason for Buffett to buy into the current GDP forecast expectations for 2023. It’s all noise when you know what higher rates do to lending.
This is why TD is watching corporate credit spreads so closely. He knows that credit spreads – the difference between Treasury rates and corporate bond rates – will widen as banking credit tightens up.
This newsletter is sponsored by Bybit. Be sure to try out the exchange here, and take advantage of all they have to offer today.