
May 30•7 min read
Is the Bottom About to Fall Out of the Market?

Corn dogs. Caramel apples. Lemonade. Funnel Cakes. Cotton candy.
Who can resist the sights, sounds, and smells of a carnival or county fair?
Back when I was a kid, there was an annual, small-scale carnival hosted by the local Catholic church that took place right around the start of the school year. It was a send-off for the summer and a fundraising event for the Catholic church.
Regardless of one’s faith, it was a fantastic weekend hangout for families and neighbors to connect over Ferris wheels and kettle corn.
Not to mention the variety of games that mesmerize the adults and kids alike.
One of my favorite games was the dunking booth.
For the uninitiated, a dunking booth is a contraption in which one person sits on a plank hanging over a tank of water. The plank is connected to a lever with a target on it. The purpose of the game is for players to hit the target with a ball, which lowers the plank and dunks the person sitting into the tub of water.
There’s an extra twist that makes the game a bit more entertaining. Sometimes, there’s a wall between the tank and the target, so the person sitting on the plank cannot see his or her fate. If there’s a net instead of a wall, he or she can see when the ball hits the target and anticipate a dunk in the tank.
But the wall provides an extra layer of suspense and an element of surprise. The reactions from the person on the plan when the bottom falls out are quite memorable.
Until you’re the one sitting on the plank.
And currently, the market across most assets has a lot of investors feeling like they’re sitting on a plank in a dunking booth, anxiously waiting for that ball to hit the target.
Grab an ice cream or a BBQ-smoked turkey as we stroll over to the market’s dunking booth.
Sitting on the Edge
Despite the amount of economic turmoil lately, the U.S. stock market is still holding up quite well after bouncing off the lows from 2022.
As of the time of this writing, the S&P 500 (yellow line in the chart below) is at 4,151.28, the Nasdaq (orange line) is at 12,698.09, and the Dow Jones (blue line) is at 32,764.65.

And recently, Federal Reserve Chairman Jerome Powell also hinted that the Fed is potentially looking to pause rate hikes.
The chatter of making a soft landing and avoiding a recession is growing louder and louder.
But let’s take a closer look at Powell’s recent market-friendly remarks.
On May 19, Powell stated that:
Developments [in the banking sector]...are contributing to tighter credit conditions and are likely to weigh on economic growth, hiring, and inflation. So as a result, our policy rate may not need to rise as much as it would have otherwise to achieve our goals. Of course, the extent of that is highly uncertain.
Powell mentioned that the Fed may pause its rate hikes because of “tighter credit conditions” in the banking sector. What that means is the effects from the rate hike measures that the Fed kicked off last year have finally manifested.
Bank lending has become stricter and tighter. The closure of banks such as Silicon Valley Bank, First Republic, and others served as the coming-out party.
But it’s not just higher interest rates that are triggering this.
The One-Two Punch
The Fed’s also been using another tool to counter inflation in the form of quantitative tightening (QT), in which it removes assets off its balance sheet to reduce the money supply.
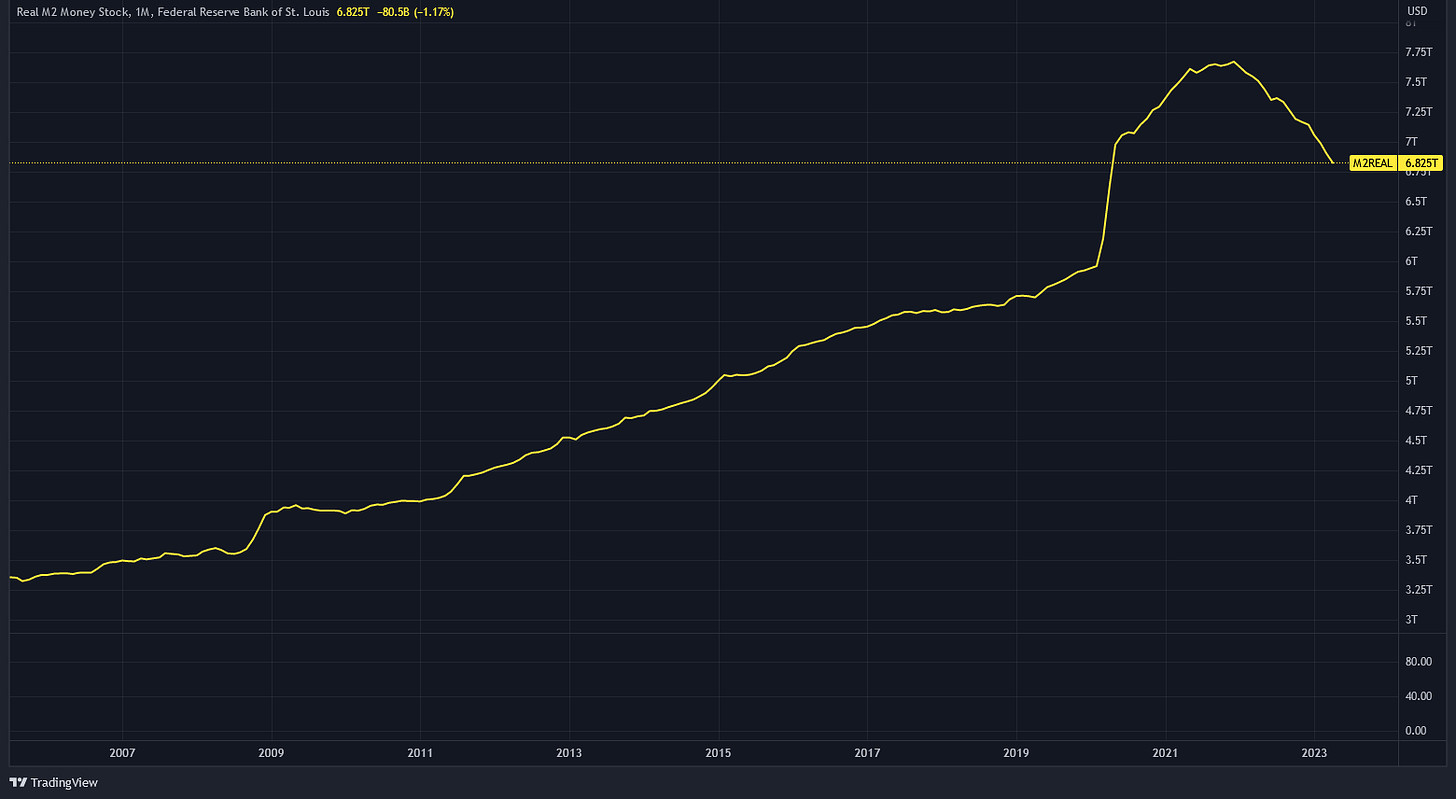
This is reflected in the chart below. It shows M2, a measurement used by the Fed to estimate the amount of money in the markets. M2 includes cash, checking accounts, savings accounts, and other short-term accounts such as certificates of deposit that cannot be instantly converted into cash.
As you can see, the M2 supply has been declining since 2022, which does not provide any comfort for the economy moving forward.
The growth or decline of the money supply is often used to forecast the upcoming economic boom or bust. The money supply expands when the economy is growing (expansion), and it contracts when the economy is dwindling (recession or depression).
Since the M2 supply is beginning to plunge, it deserves a bit more attention now.
To get a better sense of how much it’s shrinking, the chart below shows inflation (red line) and M2’s annual growth rate (black line), which has sharply dropped to minus-4.93% in April.
In other words, the amount of money in the economy is falling by almost 5% every year. This is the fastest pace of money supply destruction since January of 1933.
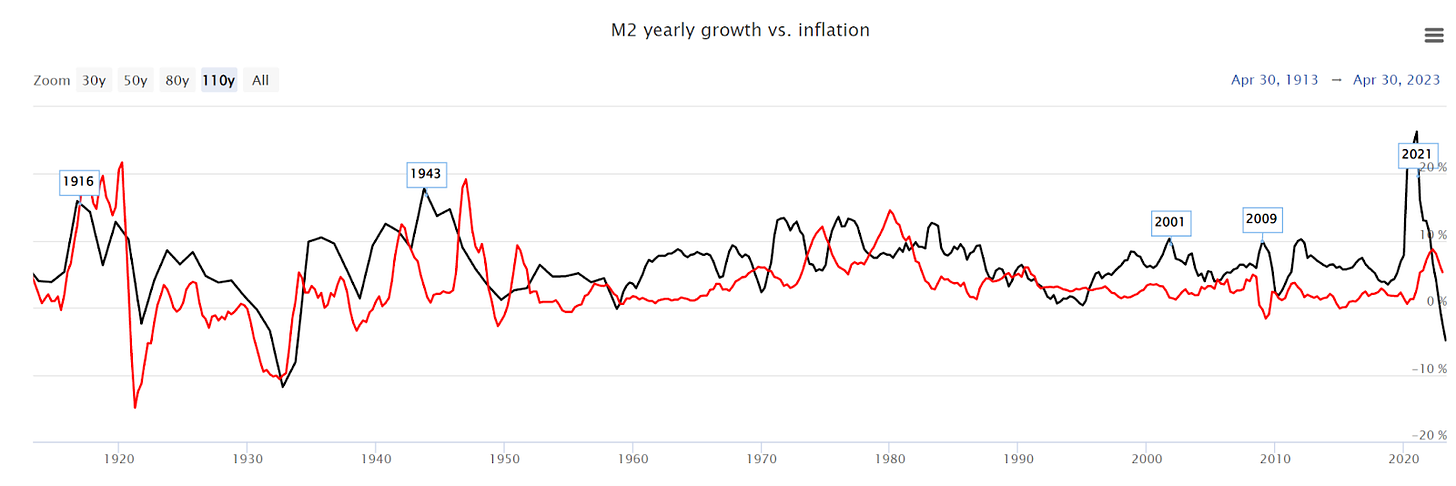
Source: www.longtermtrends.net
Both QT and the aggressive rate hikes from the Fed have forced consumers to pay higher interest on mortgages, car loans, credit card payments, and other loans with floating rates. This is pinching consumers’ cash flow.
Higher interest rates along with a falling M2 supply act as a one-two punch to curb demand for goods and services, which helps the Fed’s goal of combating inflation.
But at the same time, it chokes the spigot of credit in the form of banks and other financial credit facilities that households, corporations, and other entities often turn to.
So, it’s not a surprise that this banking crisis has manifested itself with no end in sight.
A falling M2 with high inflation does not bode well for the economy. Increased costs for goods and services while the money supply to pay for it shrinks usually leads to a period of deflation, followed by a recession or the scenario that the Fed is trying to avoid: The hard landing.
From our vantage point in the dunking booth, we can see someone winding up their throw and aiming right for the target.
So what happens next?
Bullseye!
We can expect the teeter-tottering forces of both the bears and the bulls to continue.
Going back to the M2 supply chart at the top, even though the money supply is rolling over, it is still far above the pre-COVID level.
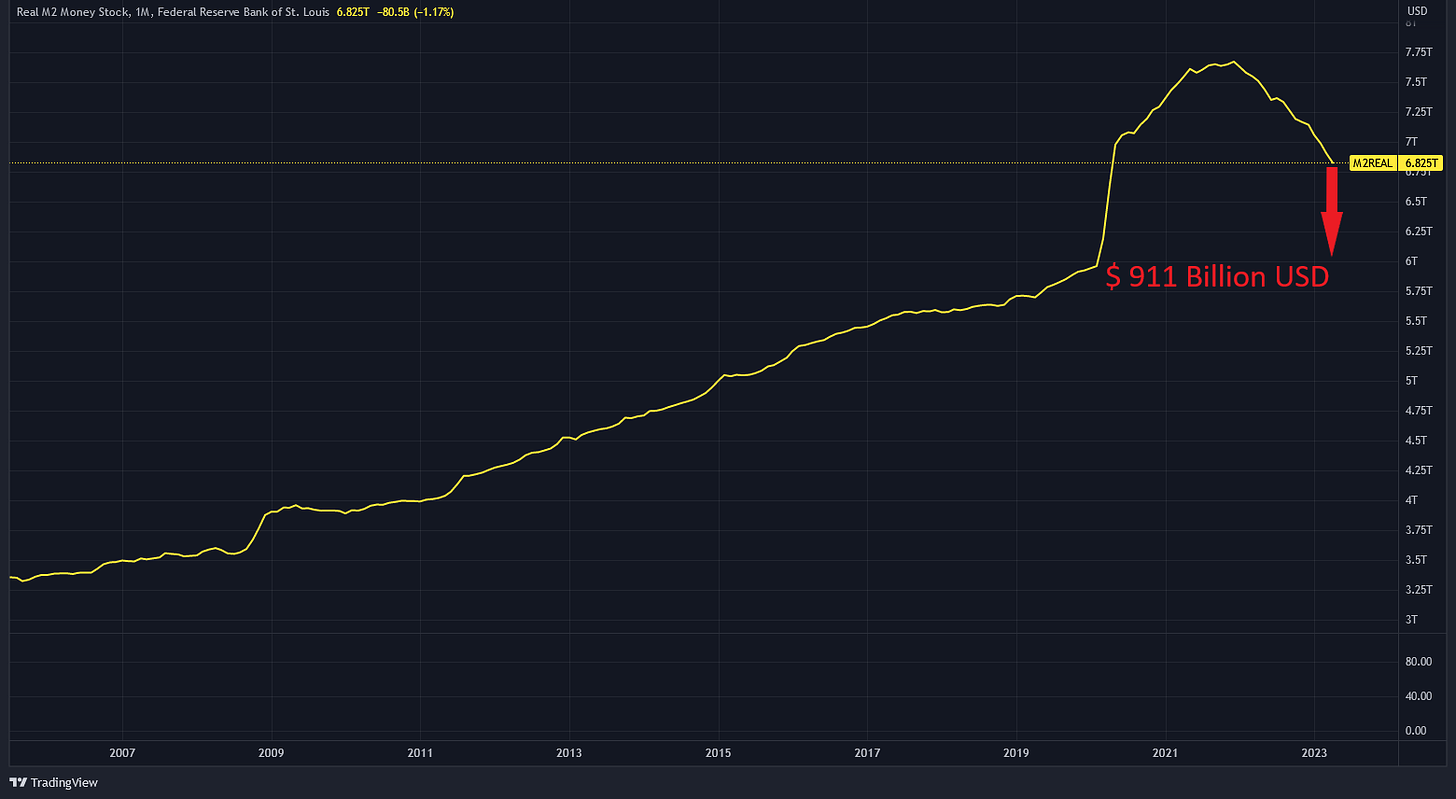
As of the time of this writing, it’s sitting at $6.825 trillion. It was at $5.914 trillion in February 2020, right before the meteoric rise.
This means there is still $911 billion worth of excess liquidity that will need to be exhausted before the COVID stimulus is completely removed from the market. With this much money still sloshing around, we can expect risk-on assets to take off at any hint of positive news.
The sharp decline in M2 supply growth is certainly not a good sign for the long-term outlook. But the landscape for the near term still remains a bit of a mixed bag because there is still so much liquidity in the system.
But this final chart should serve as a sobering reminder of what might be coming.
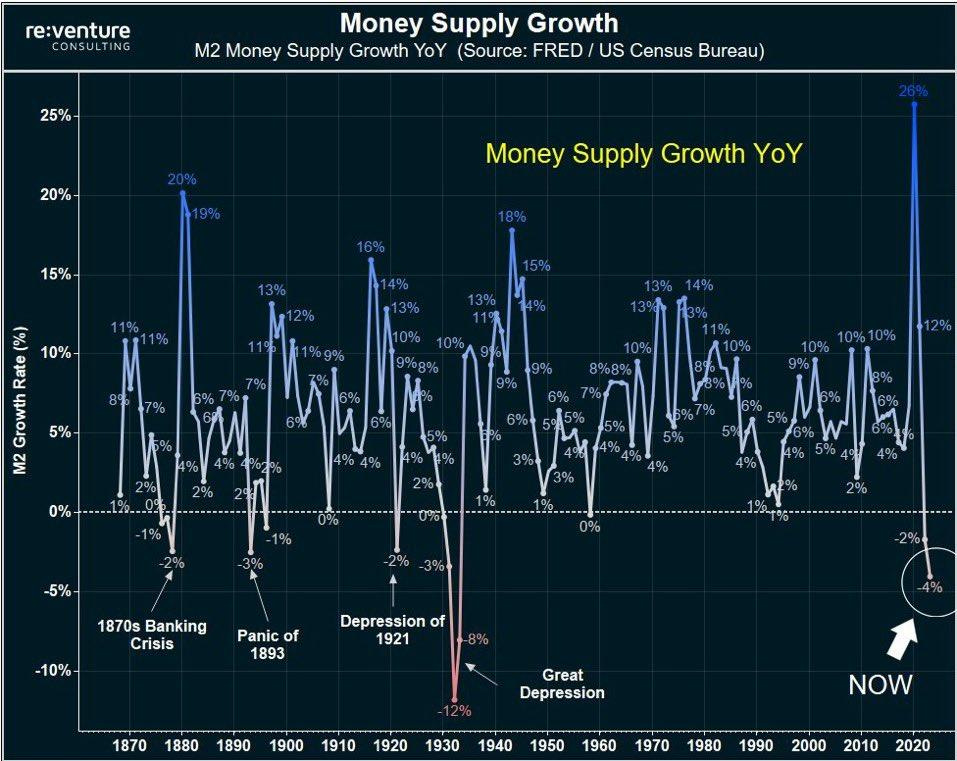
Source: Reventure Consulting
The last four times that M2 supply’s year-over-year growth plunged below zero, the results were not too encouraging.
We are not suggesting that history will repeat itself. However, it usually rhymes.
Do be prepared for the bottom to fall out and the market to take a plunge into the tank.
Yours truly,
TD
P.S. I discussed this topic more in-depth on our new podcast called Alpha Bites. It’s produced by a new studio we’re launching called xChanging Good.
Each episode will feature a group of analysts, including Ben Lilly, J.J., and myself, debating what actually matters in the markets and what we have on our radar. You can subscribe and listen to the latest episode right here.