
Jan 23•9 min read
Don’t Get Caught by the Inflation Tides

The waves crashed against the cliff wall. Water splashed everywhere. My father and I watched as the next wave came rolling in.
"We mistimed the tidal flow," my father said. In other words, we were about to be trapped on the rocks.
With fishing gear on our back and Igloo coolers in our hands, we tried to time the next wave and dash for the nearest nook to take cover before it collided against the rugged wall of rock.
Wash. Rinse. Repeat.
A few tense minutes later, we were on the sandy stretch of the beach and headed back to the car – fully drenched, of course.
That ordeal may not sound fun, but one of my favorite activities in my youth was to go fishing with my father.
We would always head down to a nearby beach and fish for sculpin, perch, rockfish and whatever other varieties were willing to take the bait.
But getting to our favorite spot involved traversing some pretty rugged terrain.
The most dangerous part of the journey required crossing a 200-foot cliff wall, which was impassable during the high tide. So we had to time the tides correctly.
The window of opportunity for fishing is usually about six to seven hours. After that, it is all about packing up everything fast and scootin’ for the car so we could avoid being stranded and waiting for the Coast Guard to rescue us.
The market’s performance at the start of 2023 and the global economy remind me of that few hours of fishing.
With a lower CPI showing inflation is cooling, and investors thinking the Federal Reserve (FED) might turn dovish, the risk-on markets are showing some cautious optimism and indicating the potential for a bear market bull run.
While the market rally and the lowered CPI print are definitely a sight for sore eyes, the potential for inflation to return still looms.
What we are witnessing right now might just be a temporary pause between the inflation tides.
And when the next tide rolls in, you don’t want to be stranded on the risk-on rock bluff.
Below, we’ll explain how we may be just starting a “Triple Wave” period of inflation…which bears an eerie resemblance to a period over 50 years ago.
Sit back and grab a coffee or a drink. We have quite a bit to unpack.
The Third Time’s the Charm
To understand the present day, let’s go back to the last lengthy period of high inflation.
In the 1970s, the decade-long inflation trend had three stages: Inflation went up and then dropped; it rose again, then dropped; and finally, in the last phase, it took a double-digit FED funding rate to slay the inflation beast.
In the chart below, you can see the three waves of inflation (red lines) with the lulls (blue lines) in between.

Source: fred.stlouisfed.org
The backdrop for the 1970s inflation cycle closely resembles the current inflation cycle: low interest rates, loose monetary policy, and geopolitical/black swan events that sent the global economy into a tailspin.
While inflation started to rear its head in the ’70s, the seeds were sown in the prior decade.
In the 1960s, the U.S. government aimed to lower unemployment. It thought it could achieve this by pushing inflation a little higher, so it started printing money.
The money supply in the U.S. went from $422 billion in 1961 to its local peak of $556.7 billion in 1969. And sure enough, inflation rose as well.
Before, inflation back in the 1960s hovered between 1-4%. With the increased money supply, it climbed from 3.38% in 1968 to 7.38% in 1971 (No. 1 on the chart above).
The Nixon administration started to implement price and wage controls to battle inflation. It worked temporarily, leading to the first lull (L1 in the chart above). But the core cause of the problem was never addressed.
In fact, it got worse. To continue to support the unemployment reduction effort mentioned above, along with the mounting pressure to fund the Vietnam War, Nixon de-pegged the U.S. dollar from the gold standard in August 1971. That allowed the money supply to steadily increase again from 1971 to 1973 from $540.1 billion to $589 billion.
Then, the first energy crisis came in late 1973 with the Arab oil embargo. Oil prices quadrupled.
All that led to the second leg of inflation from 1973 to 1975 (No. 2 in the chart below), when it climbed from 2.9% to 11.8%.

Source: fred.stlouisfed.org
And just like the pattern from the first wave, the inflationary pressure went away after 1975 (L2).
But the damage had already been done, and the tailspin accelerated in 1979.
By then, there was a 25% increase of surplus liquidity sloshing around in the financial system courtesy of the Federal Reserve’s printing press.
Plus, in 1979, another geopolitical event occurred that put a stranglehold on the crude oil market. The Iranian Revolution created another energy crisis, and oil prices almost quadrupled from the already-escalated price level brought about by the Arab oil embargo. In 1980, oil shot up from $10.11 a barrel to $39.32.
That is the third wave of inflation of the chart above (No. 3), with the highest peak of all three waves.
The dual mandates of the FED (maintain low unemployment and price stability) could not co-exist any longer. One of them had to be the sacrificial lamb.
FED Chairman Paul Volcker inherited an inflation rate of 11% and an unemployment rate of 6%. He chose to forego pursuing a lower unemployment rate in order to battle inflation instead (sound familiar?).
The rest is history.
Volcker hiked the FED rate from 13.7% in October 1979 to 17.6% in April of 1980, a full 400-basis point hike within five months. The terminal rate for the FED hike was close to 20% in 1981.
But hiking interest rates alone was not enough. Slowing down economic and money growth was the other side of that equation. So the FED deliberately drove the economy into a recession to reduce demand.
You can see this in the chart of Real Gross Domestic Product (GDP) below. Real GDP dropped from $6.84 trillion in the first quarter of 1980 to $6.69 trillion in the third quarter (R1). Although it rebounded heading into 1981, real GDP soon declined again, falling from $6.98 trillion in Q3 1981 to $6.8 trillion in Q4 1982 (R2).

Meanwhile, the Reagan administration worked with the FED in tandem by weakening the labor unions and providing tax breaks for businesses in attempts to boost productivity in order to bring down cost-push inflation.
And it worked. Inflation eventually stabilized in the 1980s.
Fast forward to today.
Time to Go Fishing
2022 was a year we saw high inflation, aggressive rate hikes, and market chaos.
The setup for the first wave of inflation that’s now winding down was very similar to the 1970s.
The loose monetary policy that started back in 2009 – to rescue the economy from the subprime mortgage crisis – still lingers in the system. The dollar supply went from $736.8 billion in February 2009 up to $1.5 trillion in December 2019. That is more than a 100% increase in 10 years.
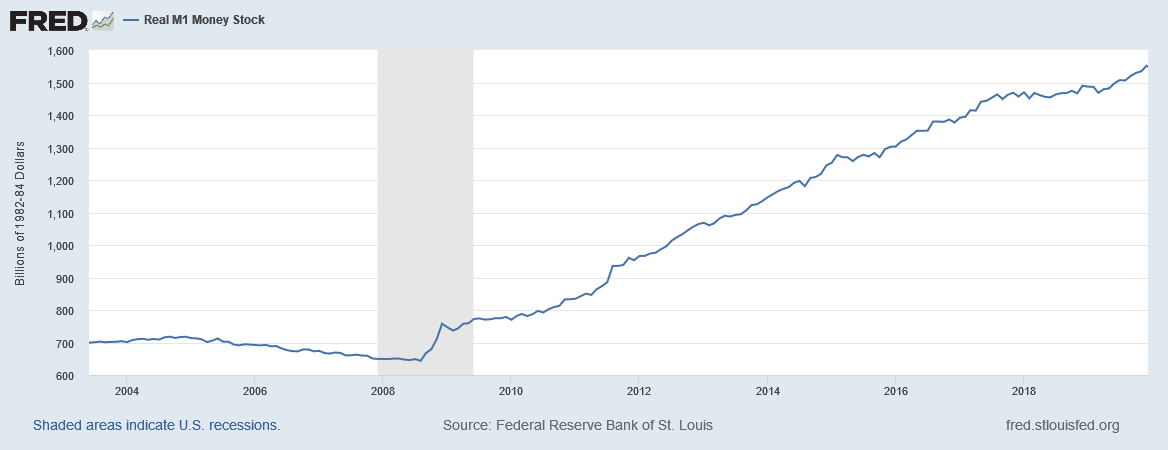
Source: fred.stlouisfed.org
But it is only child’s play compared to how the money supply expanded during the COVID-19 pandemic.
In February 2020, the supply was over $1.5 trillion. By the time the COVID-19 relief was all disbursed in January 2022, the money supply ballooned to an eye-popping $7.3 trillion.
That is a 4.7X increase within two years.
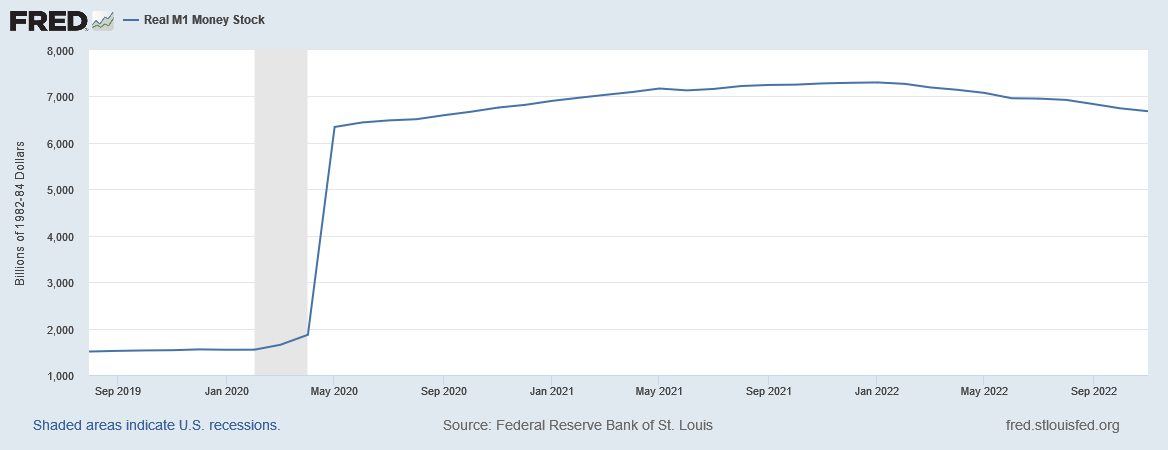
Source: fred.stlouisfed.org
It’s never been done throughout the history of mankind.
And the U.S. is not alone. The European Union, Japan, and China all turned on their printing presses.
COVID-19 is a black swan event that not only triggered the largest liquidity injection by central banks in history, but also set off the first wave of inflation by disrupting supply chains, which generated shortages and increased demand.
Then, as if the world wasn’t chaotic enough, Russia decided to invade Ukraine, which sent energy prices sky-high, exacerbating the problem.
Overabundance of liquidity from loose monetary policy?
Check.
Black swan event to create imbalance in supply and demand by disrupting logistics?
Check.
Geopolitical event that generates an energy crisis and sends inflation and living expenses soaring?
Check.
All the elements required for a prolonged inflation run, like the ’70s saw, are in place.
Enter the Lull
After that first spike we saw, we are possibly looking at two more waves of inflation.
But for now, the sun is out.
We could be entering the first lull between the first and second inflation tides.
With the global supply chain returning to normal, inflation pressures are easing, especially in terms of energy.
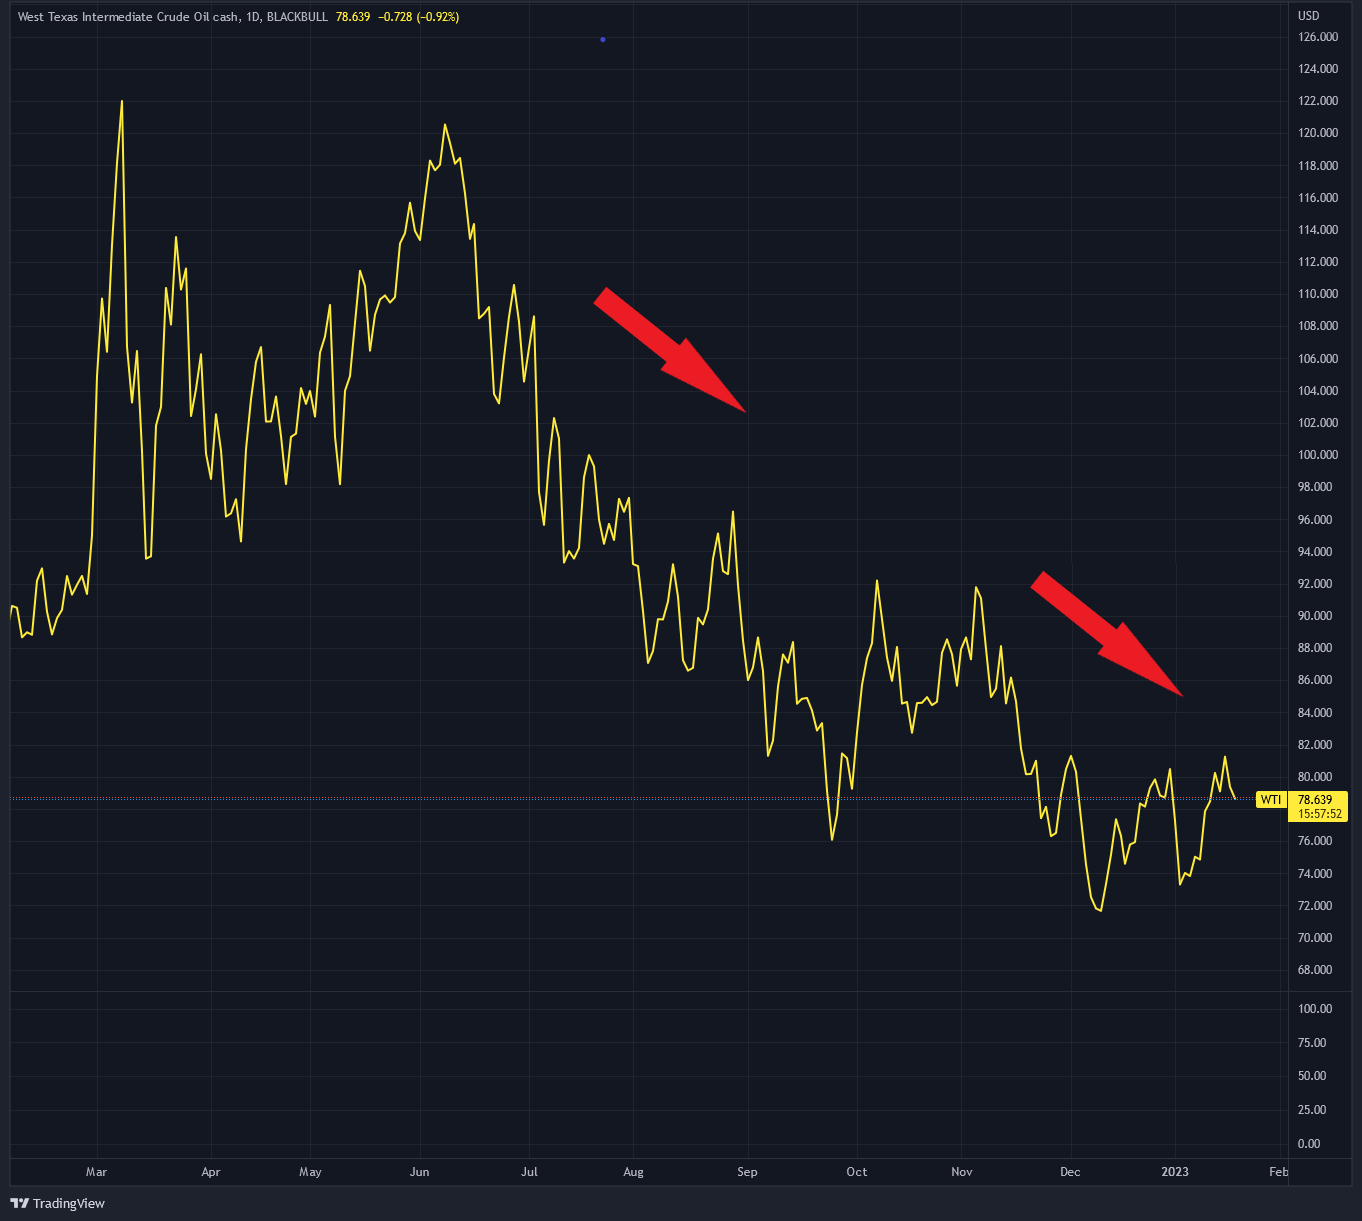
Oil has stayed below $100 per barrel since July, and it’s been hovering between $70-$80 since the beginning of December.
Below is a chart of West Texas Intermediate Crude Oil (WTI).
Part of the reason is that Europe has had a warmer winter than expected so far. (A buddy of mine in The Hague told me that the Netherlands had some of its warmest New Year’s Day temperatures on record.)
This allowed Europeans to use less natural gas than they expected. This lower demand tanked natural gas prices, which fell from a peak of $9.79 to today’s $3.13.

And this coincided with the CPI reading for December 2022 that came out this month, which posted an almost as-expected 6.5%. The biggest drop was in energy prices.
Another indicator for inflation heading lower in the near future is the Baltic Dry Index (BDI). BDI measures the cost to ship goods worldwide.
During the peak of the COVID-19 pandemic, BDI reached 5,647. Today as of writing, the BDI is sitting at 874. That is almost a 7x decrease from the COVID-19 high.

Over-inflated prices caused by disruptions from COVID-19 are starting to fade away. And the effects of the invasion of Ukraine should start to dissipate as the energy market will treat it as the “new normal.”
Inflation seems to be tamed – for now.
From the markets’ reaction, investors seem to believe we have reached peak inflation, and the FED will resort back to rate cuts and quantitative easing to resuscitate a faltering economy.
But not so fast.
There are inflationary pressures still hiding underneath the waves.
We will discuss what could trigger the potential second and third waves of inflation in our next installment.
Yours truly,
TD