
Apr 12•11 min read
Powell’s Trouble With the Curve

Top of the ninth inning. Two outs. Bases are empty.
The pitcher stares down home plate. He’s sweaty and nervous. He steps off the mound and mutters to himself, trying to talk some confidence into his psyche.
He has a 2-0 lead. But he needs one more out to get a shut-out.
Pitching a complete game is no small feat. Pitching a complete game and a shut-out is exponentially more difficult.
The pitcher gets back on the mound again, looking at the catcher for the sign of what pitch to throw. Fastball or curveball?
The catcher signals for a fastball.
But the pitcher shakes off the signs. He wants to throw a curveball.
Fed up with his teammate’s ignorance, the catcher tells the hitter a curveball is coming. Just to show the pitcher who is in charge.
The pitcher throws a curveball. Knowing what will be coming, the batter hits the ball right on the nose, and it goes soaring over the outfield wall.
This is one of the funniest scenes from one of the all-time great baseball movies, Bull Durham.
In baseball, the catcher commands the team on the field, including the pitcher. The catcher tells the pitcher which pitch to throw and what location to throw the ball to.
When the pitcher disagrees with the pitch call, he or she can shake it off and ask for a new pitch to throw.
But most of the time, the catcher runs the show.
When I think of the catcher in that scene, I cannot help but picture Jerome Powell, chairman of the Federal Reserve (FED).
Powell keeps signaling the market on what he wants to do: push forward with quantitative tightening (QT) and continue to raise interest rates to combat inflation, which is still running hot at 5%, according to the latest Consumer Price Index (CPI) numbers.
But the market, just like the pitcher, keeps shaking it off and insisting that the FED will have to pivot soon and resort back to quantitative easing (QE), which means more money printing and interest rate cuts.
The recent banking turmoil with Silicon Valley Bank, Credit Suisse, and others has only strengthened the market’s case.
But if that isn’t enough to make Powell pivot, what would?
Last week, we discussed one indicator in the corporate bond market that’s worth keeping an eye on as pressure builds on Powell.
This week, we’ll discuss a few more indicators that give us more of an idea of when a FED pivot could happen – and how the latest inflation numbers factor in.
Let’s get on the pitching mound and look for the signs.

Ben Lilly here. As you know, we want to take Espresso to the next level. To do so, we’ve explored bringing sponsors into our newsletter, but in a way that first and foremost benefits you, our readers. To that end, we aim to share introductory offers that give you an opportunity to trial new services, tools, or exchanges.
We are excited to announce our first sponsor, the trading platform ByBit. For those who have been looking for a new exchange, consider checking them out.
They operate in 160 countries. They have more than 270 assets trading on spot and over 200 perpetual and quarterly futures contracts. They even offer options contracts and NFT trading.
Simply put, ByBit has a lot to offer any trader. And right now, they are offering a $10 welcome bonus if you open a new account and complete some introductory tasks. They also have additional ways for you to earn. So if you are looking for a new platform to trade on, consider ByBit today by clicking here. Also, if you simply want to support Espresso and the Jarvis Labs team, consider giving a click.

Trouble With the Curve
It’s the buzzword that currently permeates every media outlet, to the point where one cannot get through the day without hearing it.
“Recession.”
It’s why the market and investors are betting on the FED to pivot. They are quite confident that an economic recession is coming, especially after the shockwaves that have rippled through the banking sector. With more people withdrawing their money in light of the recent scare, banks have less capital to lend, which could dramatically impair the economy.
Perhaps the government will be able to patch up the leaks in the banking system and avoid a full-blown crisis.
But a recession is still likely, because we got another sign of one coming. And this one has a 100% hit rate.
The yield curve has inverted.
If you’re unfamiliar, please refer to our article “Managing the Curve” from last year for a quick brush-up on the yield curve.
Simply put, a normal yield curve should have a trajectory profile like the picture below.

The longer the time horizon (also called the maturity or tenure), the higher the yield, because of risks, margin of utilization, and opportunity costs.
Hence, due to longer time to maturity, the 10-year Treasury note’s yield curve should always be hovering above the 2-year Treasury note’s yield curve.
But once in a while, the yield curve of short-term bonds actually rises above that of long-term bonds.
This is known as the inverted yield curve.

There are a few reasons the yield curve can become inverted.
For example, if you’re investing in corporate bonds, and you suddenly have doubts about a company’s long-term growth or profitability, you’ll seek higher rates over the short term rather than the long term.
The same thing happens with government bonds when there are concerns over a government’s ability to repay its debts. Investors demand higher interest rates for the short term, or they are worried about economic conditions in the future (such as a looming recession) and want to lock down the long-term rate now.
In the chart below, the yellow line is the yield curve for the 10-year Treasury (currently at 3.400%), and the orange line is the yield curve for the 2-year Treasury (currently at 3.968%). This is a spread (difference between two yield curves) of more than 50 basis points, or 0.5 percentage points.
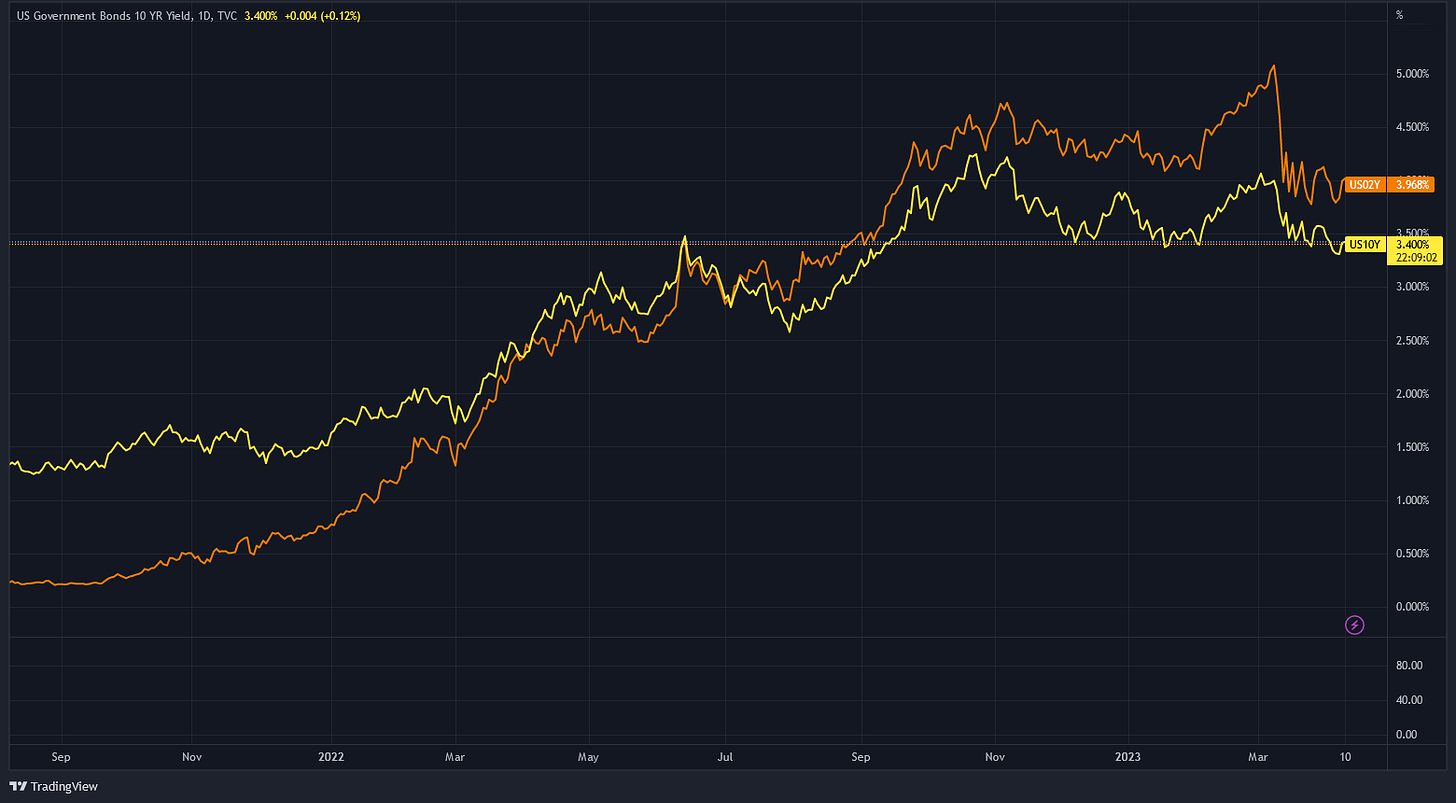
This inversion started back in July of 2022 – nine months ago.
The length of an inversion doesn’t necessarily mean a deeper or longer recession. But it does reflect investors’ extremely negative sentiment of economic conditions.
And it has a track record of predicting recessions that can’t be ignored…
Perfect Record
The ultimate weather vane for predicting a recession is a yield curve inversion. Specifically, when the yield curve of the 2-year Treasury note climbs above the 10-year Treasury note, as shown in the chart above.
According to the Federal Reserve Bank of San Francisco, an inverted yield curve has preceded an economic recession 10 times over the last 60 years.
The chart below shows that phenomenon going back to the mid-1970s. You can see that every time the 2-year yield overtook the 10-year yield (indicated by the ratio turning negative), a recession (vertical gray bars) appeared soon after.

Source: Reuters
There is generally a lag time of six to 24 months between when the yield curve inverts and when a recession starts to kick in.
Below, we have a chart that shows the number of months between yield curve inversion and the start of a recession from 1978-2022.

Source: Statista
It’s looking more and more likely the FED’s aggressive rate hikes and QT policy will trigger a recession (if they haven’t already).
And that’s the siren song for the FED to shift in reverse, begin cutting interest rates, and start printing more money.
Rates Are Rising, But You’re Still Losing Money
While the market has a compelling argument for the FED to pivot, Chairman Powell and his colleagues at the FED also have a solid reason for staying the course.
While inflationary pressure is showing signs of cooling, it’s still running too hot for the FED’s liking.
In March, the CPI, the most popular measure of inflation, ticked up by 0.1% from the month before, with a year-over-year (YoY) change of 5%.
Meanwhile, the FED’s go-to inflation indicator, the Personal Consumption Expenditure (PCE), rose 0.3% in February, with a YoY change of 5%.
In the past, we’ve discussed a few items that have been fueling this inflation, including this insight on liquidity and this update from Ben Lilly. But there’s another component working in the background.
Even though interest rates have been rising, they’re technically negative.
You can see this by comparing the nominal rate with the real rate. The nominal rate is the interest rate without making any adjustments for inflation or other factors. It’s what everyone pays for loans and mortgages.
But the real rate is derived by subtracting the inflation rate from the nominal rate.
If inflation is at 5% and the nominal rate (i.e. the Fed funding rate, or FFR) is at 4.75% , then the real rate is negative-0.25%.
Generally speaking, when the real interest rate is negative, people tend to be a bit more aggressive with risk-taking. This is because their money depreciates and loses value even if it’s in safe investments like Treasurys. By buying Treasurys that pay 4.75%, the investor still loses purchasing power by 0.25% because inflation is at 5%.
Over the past two decades, the market has been no stranger to negative real interest rates.
The chart below shows the real rate of interest in blue, inflation in red, and FFR in black.
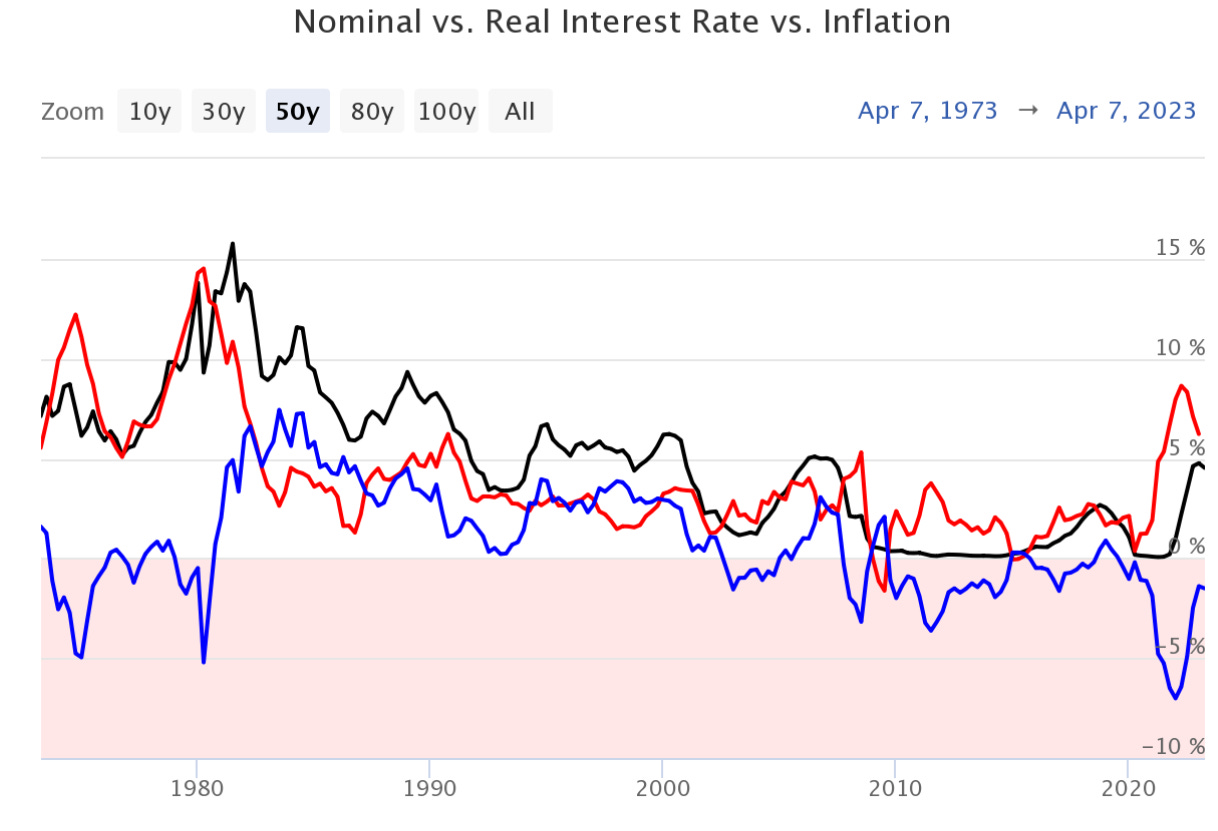
Source: longtermtrends.net
Since the dot-com bubble in 2000, the real rate of interest has spent most of its time in negative territory.
This is not surprising. From 2002 to 2004, the FED lowered interest rates to stimulate an economy that took a blow from the dot-com bubble.
But that brought on a new set of problems: Then-FED Chair Alan Greenspan kept the rate too low for too long, and it eventually gave birth to the real estate bubble and brought the world the 2008-2009 subprime mortgage crisis, otherwise known as the Great Financial Crisis (GFC).
As a result, Greenspan’s successor, Ben Bernanke, issued the famous helicopter money statement. That is when the FED and central banks around the world started QE and printed money.
They also implemented policies such as Zero Interest Rate Policy (ZIRP) and Negative Interest Rate Policy (NIRP) in attempts to resuscitate an ailing, deflationary global economy. The goal was to induce the demand-push inflation that we had discussed in the previous update.
So for most of the past 20-plus years, the real rate was negative – but it was on purpose. Central banks wanted to generate more economic activity, speed up the velocity of the money supply (M2), and try to get their economies out of a deflationary environment.
But due to the reasons we have discussed here, these loose-money and zero-interest rate policies did not increase the velocity of M2. Rather than generating productive activity out of the economy, instead it all went to pump up asset prices.
Not seeing the results intended, central banks doubled down. They printed more money, and ZIRP and NIRP kept going for longer. Alas, it provided the fuel for the inflation inferno that we are seeing today.
While in the past, the negative real rate was viewed as a panacea to rescue a battered economy, now it is perceived as a hemlock. That’s why the FED is trying to bring the real rate into positive territory.
The Real Danger of Negative Real Rates
Negative real rates mean negative yields. That is bad news for investors. It pushes people to move money out of their bank accounts or mattresses and edge further out on the risk curve.
Unfortunately, this is still the environment that we are in. And it’s what’s spurring inflation.
Inflation cannot be tamed when the real rate is still negative. The real rate has to be positive for a consistent amount of time if there’s to be any hope of dousing the inflation blaze.
In other words, the nominal rate will have to be higher than the inflation rate.
We have yet to see that. But the FED appears to be getting closer and closer to that goal.
The market is still staring down the FED from the pitcher’s mound. It expects Powell to blink at any moment with an inverted yield curve predicting a recession on the horizon. And the banking crisis only amps up the pressure.
But the FED cannot afford to take its foot off the gas pedal of the Rate Hike Express when the real rate is still negative. So it continues to shake off the market.
While we don’t have a distinct answer for when the FED will pivot, when the real rate climbs out of negative territory, we will be one step closer to that shift.
Yours truly,
TD
This newsletter is sponsored by Bybit. Be sure to try out the exchange here, and take advantage of all they have to offer today.