
Jul 09•7 min read
Bitcoin’s Next Target: A LUNA Leftover

$2.5 billion gone in 72 hours.
In early May 2022, the Luna Foundation Guard (LFG), one of the organizations behind the Terra ecosystem, was in crisis. Its stablecoin, UST, had lost its $1 peg. In an attempt to rescue the peg, the LFG puked up 80,394 BTC over a three-day span, costing it billions.
Of course, it was unsuccessful. But that mass liquidation event, which sent crypto markets into an industry-wide death spiral, and ultimately crescendoed with the fall of FTX late last year, notably began on a weekend, when order books are notoriously illiquid.
Due to the billions of dollars’ worth of BTC the LFG was forced to sell, and the lack of weekend buyers willing to take the other side of their trade, it led to a significant discrepancy between the price of Bitcoin on Friday afternoon when legacy financial markets closed, and the price of BTC when the markets reopened the ensuing Sunday evening.
This volatile weekend price action created what’s known as a “CME gap,” a reference to the favored exchange of institutional players – the Chicago Mercantile Exchange (CME).
For answers as to why what happened during the fall of LUNA in May 2022 is still relevant when analyzing Bitcoin’s price action today, and how the CME factors into all this, let’s take a deeper dive below.
Minding the Gap
The CME operates much differently from the casinos we crypto-native degens are accustomed to. For instance, rather than trading 24/7, Bitcoin futures contracts on the CME trade during specified hours. These trading hours are Sunday through Friday from 5 p.m. – 4 p.m. CST the next day, with an hour break from 4 p.m. – 5 p.m. each day.
Notably, there is no trading on Saturdays, and the majority of the day on Sundays.
This difference in trading hours between the CME and the continuous spot and futures trading of Bitcoin elsewhere around the globe occasionally leads to market inefficiencies in Bitcoin’s price known as price gaps. These gaps emerge between the Friday 4 p.m. close when the CME shuts down and the Sunday 5 p.m. futures market open.
Smaller gaps, ranging a couple of hundred dollars in either direction, are common and tend to be filled within a few days’ time – meaning the price eventually reverts to the level of the previous Friday close at some point during the following week.
However, there have been rare instances of extreme price movements during the CME's off hours in which price did not immediately return to the previous range.
One such instance occurred during the late 2020-early 2021 bull run when Bitcoin first surged above $25,000 on a late December weekend. By the time the CME reopened, the price was above $26,000, and BTC didn’t look back until over 18 months later.
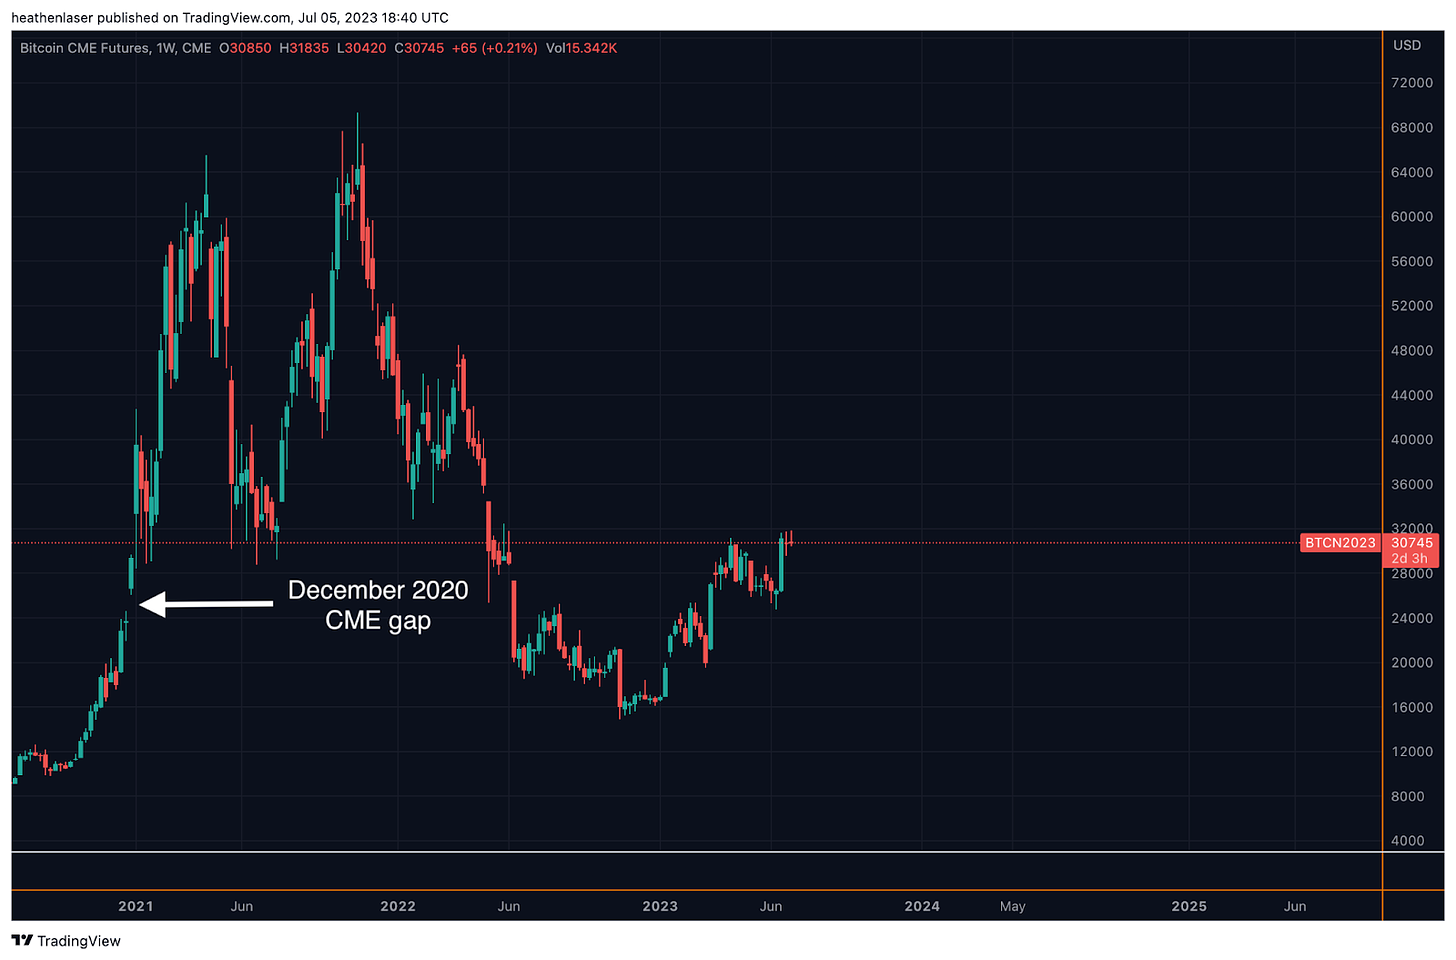
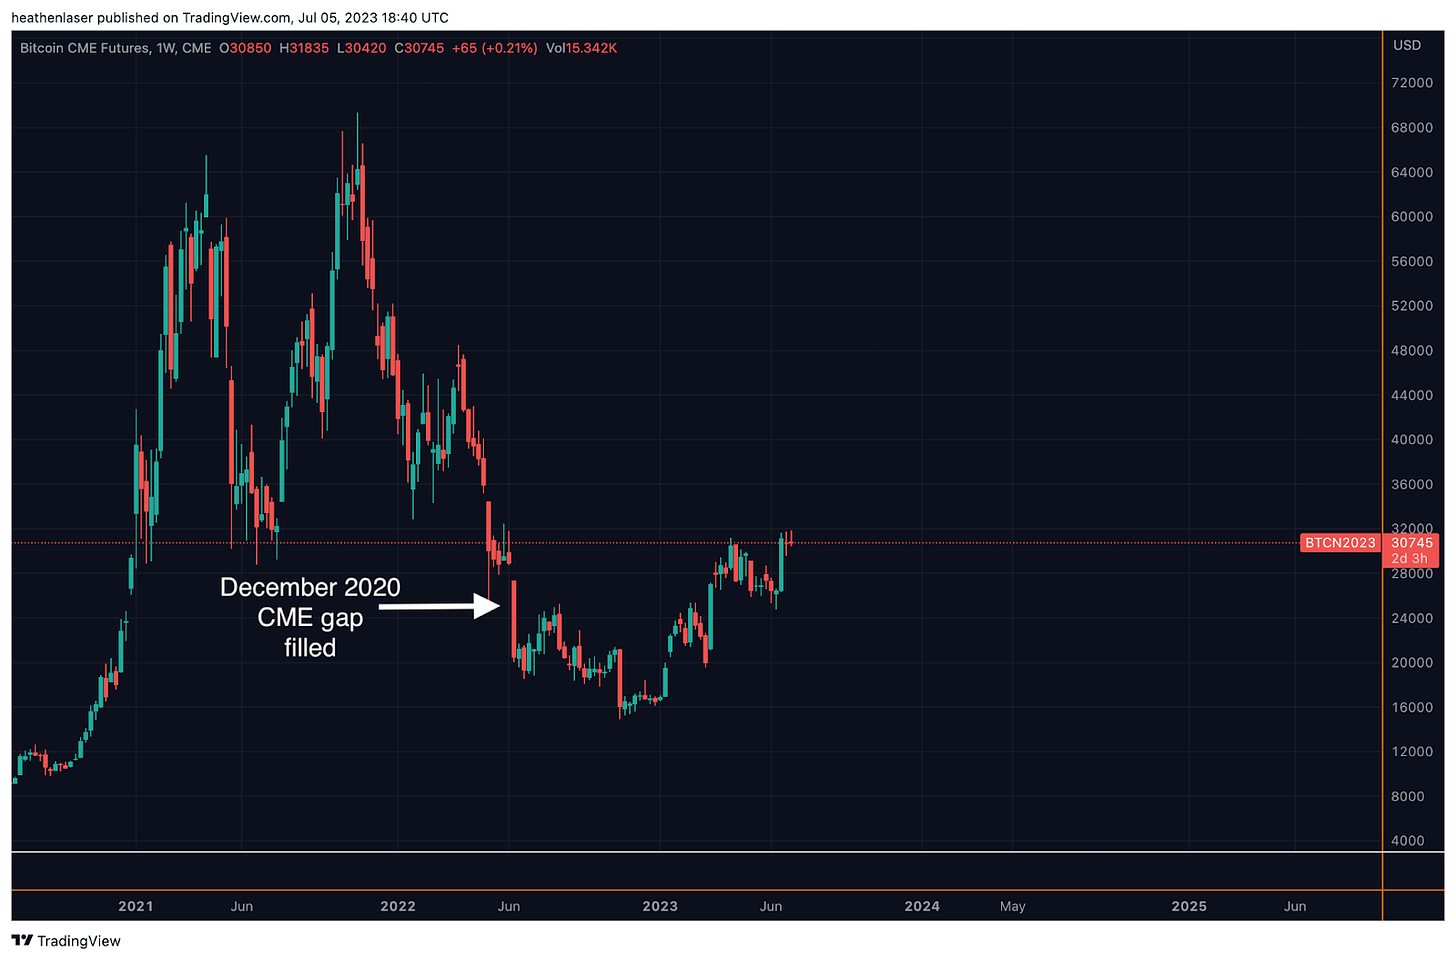
…but it did eventually fill that gap by retracing to below $25,000. It just waited for everyone to forget about it first.
Once the post-LUNA contagion began to spread last June and caused the meltdowns of 3AC, Celsius, BlockFi, and others, price returned to the pre-gap level like a delayed boomerang, and thus settled the market discrepancy.
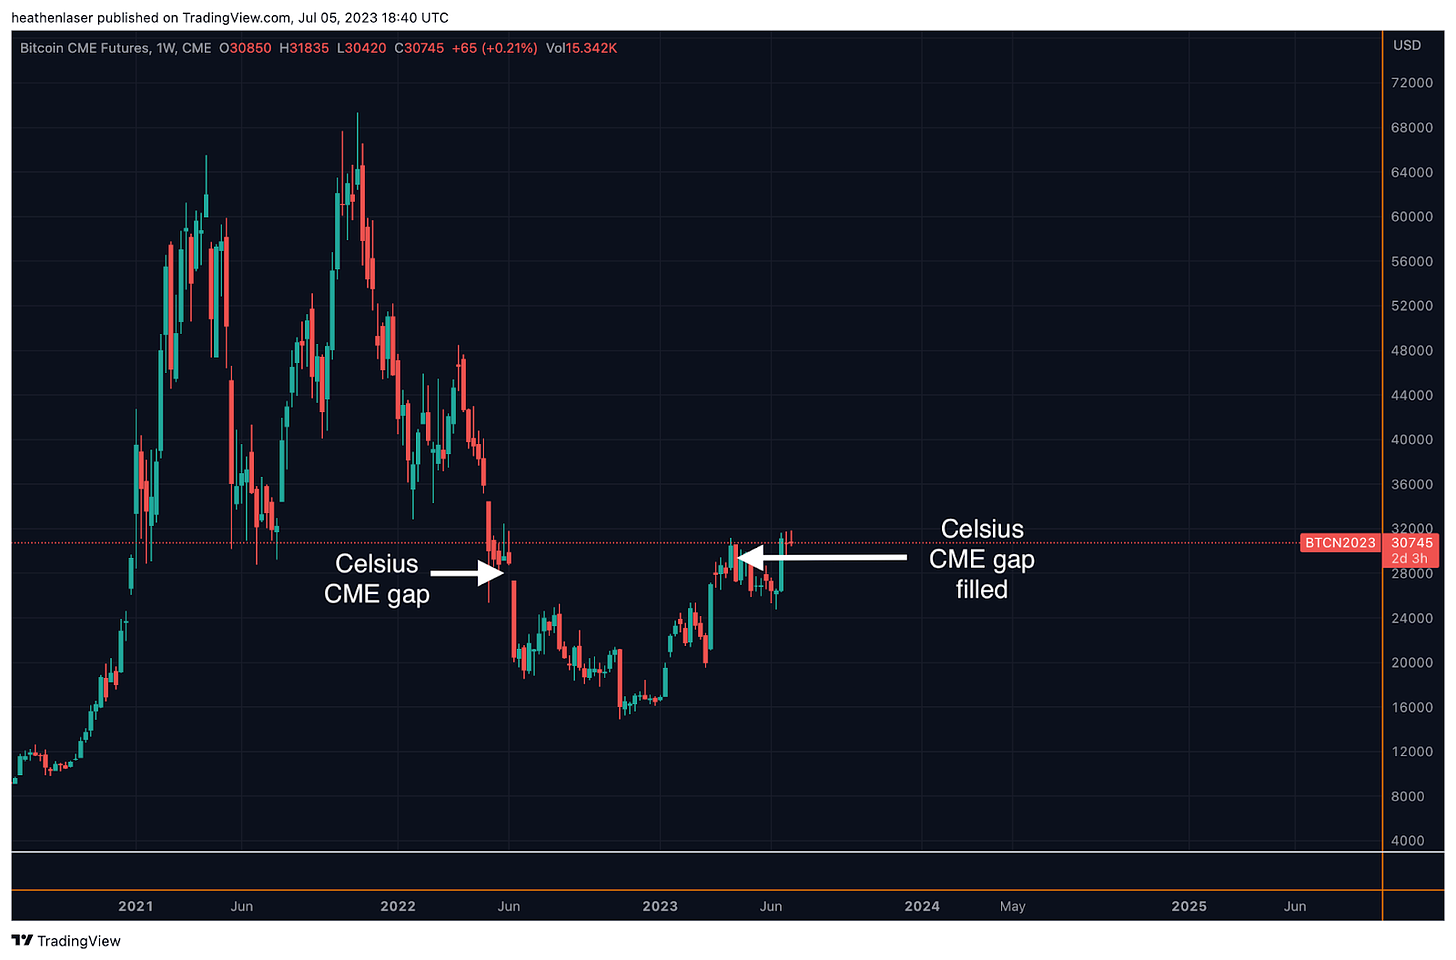
Ironically, that gap fill to the downside created an overhead gap of its own around $28,500, which is where Bitcoin’s price was prior to Celsius collapsing during the weekend of June 11, 2022.
A gap that wasn’t filled until April of this year when BTC reclaimed the level – once again after everyone forgot it existed.
The reason for me bringing up these past gaps, and the market's tendency to fill them, is that there remains one more notable CME gap to the upside, which is left over from the start of the LUNA debacle last May.
As I mentioned earlier, that event involved selling extraordinary amounts of BTC over a single weekend, and as we’ll see below, resulted in a large CME gap overhead around $35,100.
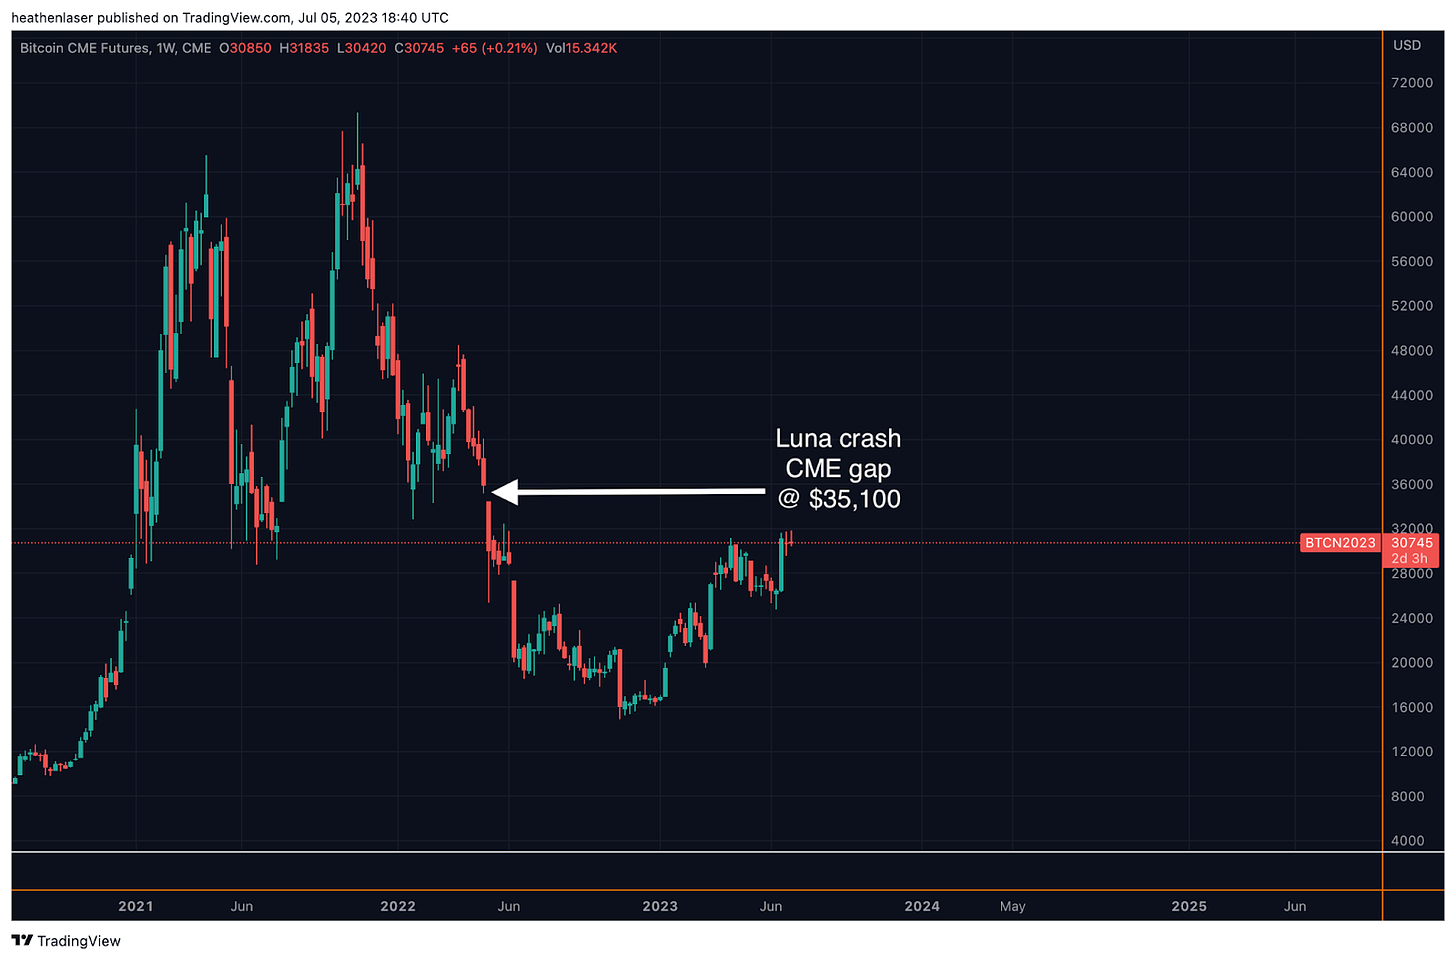
Since that was only the first of many forced liquidation events in 2022, price never had a chance to recover and close the gap left behind around $35,100.
That is of course, until now, as BTC is threatening to return to the pre-LUNA range for the first time in over a year (though it feels like a lifetime).
If BTC can manage to break out above $32,000, the LUNA gap resting at $35,100 will quickly come into play.
But proceed with caution and avoid counting your chickens before they hatch, as Bitcoin’s ability to get there still depends upon two key factors in my mind:
The SEC granting spot ETFs the ever-elusive stamp of formal approval.
The U.S. Dollar Index (DXY) confirming its recent breakdown and falling to new year-to-date lows from here.
Cementing the Bull Run
As always, I don't want to leave you with a singular view of the market, so here’s a quick update on our old friends, DXY and gold, two of Bitcoin’s leading indicators.
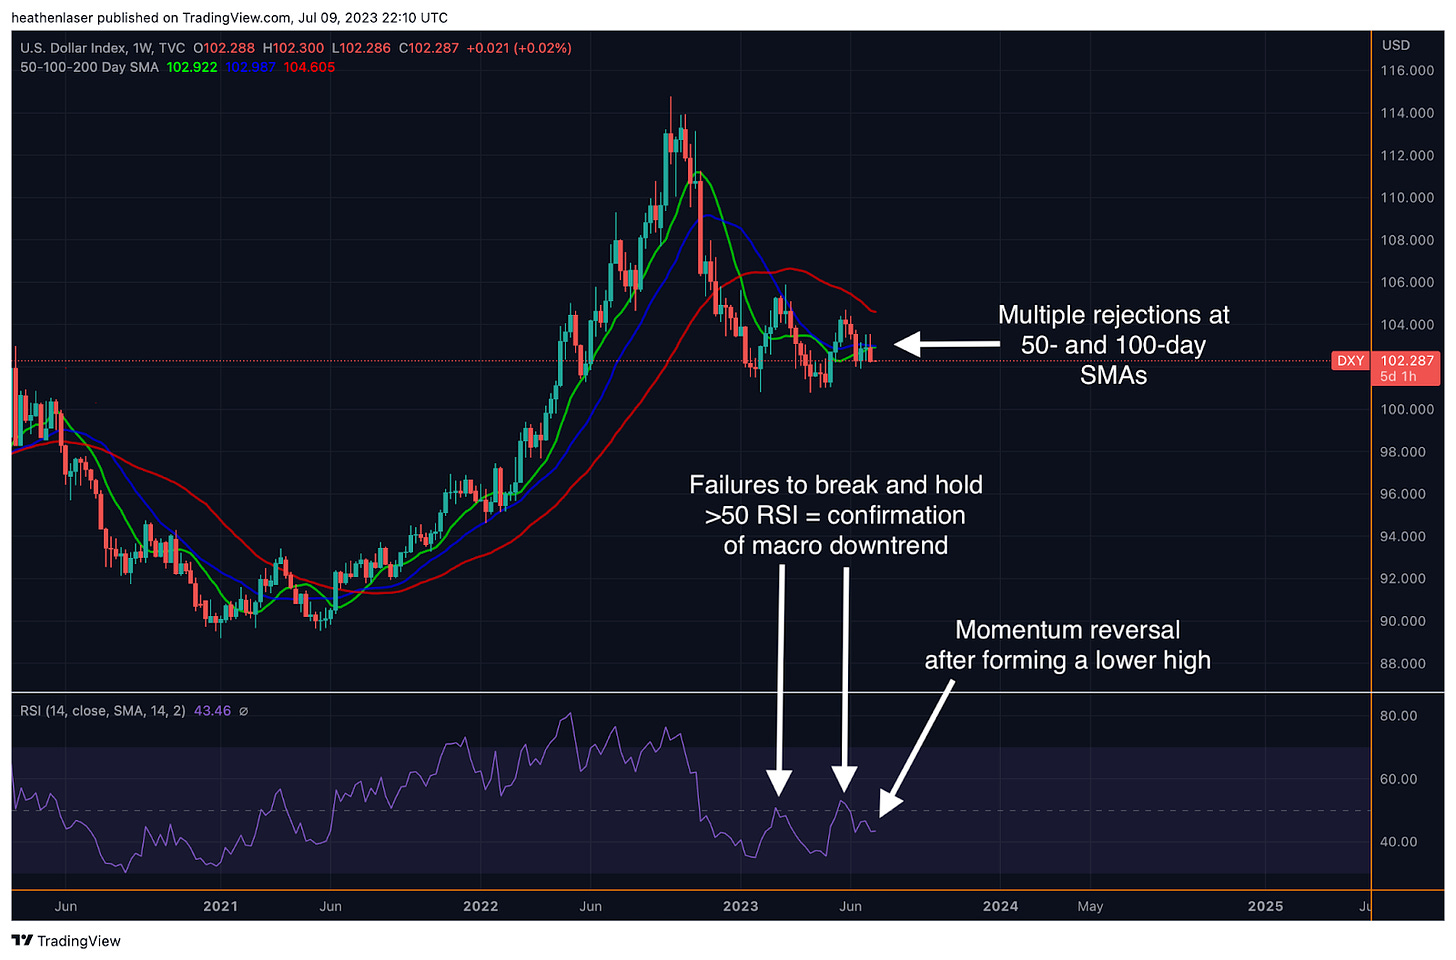
As I mentioned in “Bitcoin’s Perfect Storm,” the dollar has continued to remain resilient above the ever-crucial 100 mark, but late last week, it finally began to show some signs of cracking.
Not only did it fail at the 50-RSI mark on its weekly chart, it has also fallen back below its 50-day (green line) and 100-day (blue line) moving averages (MAs) which now appear to have become resistance, at least for the time being.
It’s odd to see such bearish price action unfolding on the dollar chart, given where terminal rates are. In the chart below, you can see the terminal rate, the market’s expectation of how high the Fed will hike rates, is now the highest it’s been since the week prior to March’s banking crisis, when DXY was trading over 106.
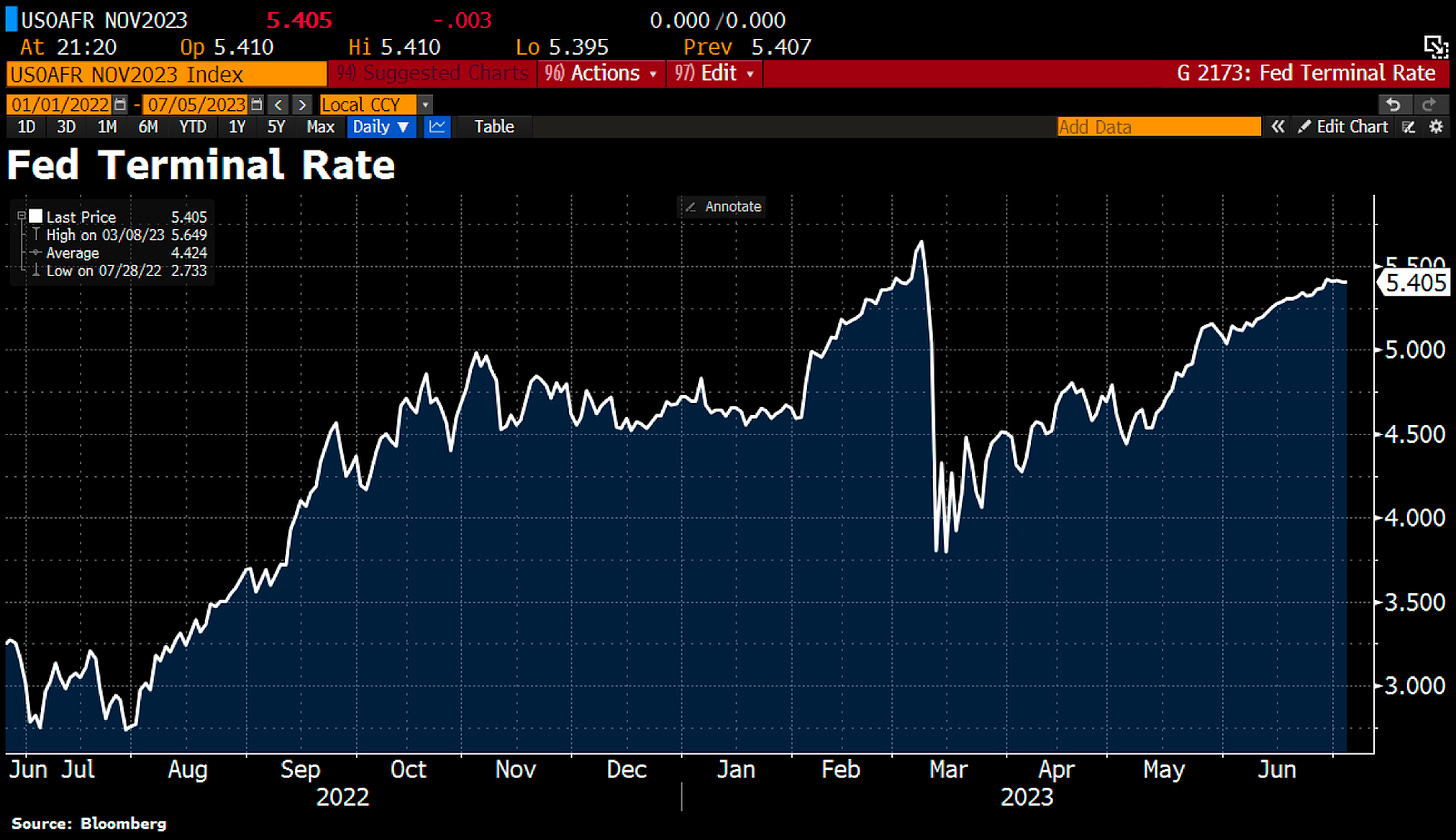
In fact, the rates market is now pricing in an additional 25 basis-point hike coming at July’s FOMC, followed by a prolonged period of “higher for longer,” as speculators have now formally capitulated on any hopes for a cutting cycle to begin in 2023.
The contrarian in me tends to believe this discrepancy between the dollar’s fundamentals and DXY’s price action is telling us that the long dollar trade has become overcrowded due to the rates market at long last capitulating, and as a result, new sub-100 lows may finally be on the menu before summer is up.
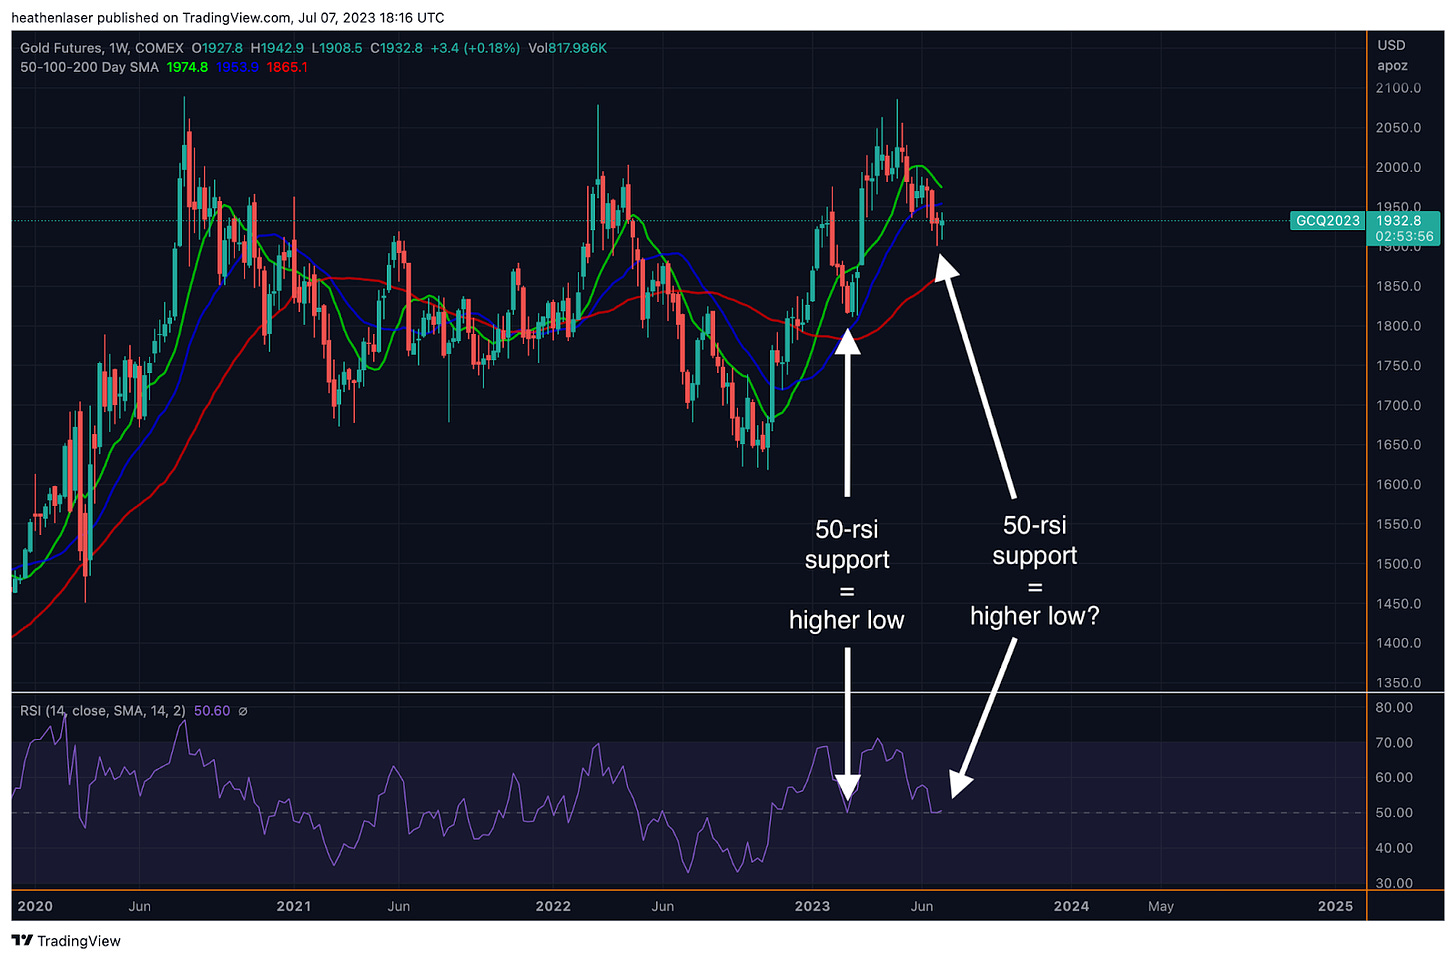
Gold may be hinting at the same conclusion, as we’ll see below. Though it's been in a firm downtrend since the dollar rally began in May, it crucially remained above its 200-day SMA (red line) while the dollar has fallen short of reconquering its own 200-day SMA.
And while gold still remains well below its 50- (green line) and 100-day (blue line) SMAs, its RSI on the weekly chart, which so far has held onto the 50 level despite the strong sell-off, is suggesting that the recent cycle low may be in, and a reversal back to the $2,000 level could soon be in store.
In fact, its current set-up is showing much symmetry with the pattern that took it from ~$1,800 during the March crash, to all-time highs above $2,080 in April.
Given the dollar’s inverse correlation to BTC, and gold’s historic reliability as a leading macro indicator for the crypto, these are potentially promising developments to keep a close eye on, but we’ll still need to see confirmation movements into the end of month to say for certain.
How the rates market, and consequently DXY and gold, react following this month's macro events, such as CPI and the July 26 FOMC meeting, will be crucial in determining BTC’s path from here.
Should the dollar’s downtrend continue, that is a catalyst which will add fuel to BTC’s attempt to close the LUNA CME gap, especially if it’s paired with the SEC formally approving the slew of BTC spot ETF applications. That’s the kind of confluence we would need to “cement the bull run.”
My bias still remains to the upside for now, but at these extremes, with so many mixed signals floating about, caution with a willingness to flip directions at a moment's notice if the market tells us otherwise is a must.
Until next time, mind the gaps, please.
Your friend,