
Feb 08•9 min read
Don’t Get Shaken Off Bitcoin’s Golden Bull

The cowboy takes a final drag of his cigarette and wipes the sweat from beneath his stetson.
All around him the crowd is raucous, but in that moment he hears nothing. His attention is transfixed on the task at hand.
He closes his eyes, bites down on his mouthpiece, and prepares for the thrill of a lifetime.
In mere seconds, the sound of clanging metal will echo throughout the arena as the gates shoot open, and thrust him out into an open pen where he will ride on the back of a raging beast.
It’s the bull rodeo – “the most dangerous eight seconds in sports.”
That name comes from the rule that riders must last a full eight seconds on the bull in order to qualify. Those who do then receive a score for their performance, based not only on how long they lasted, but also the skill and grace with which they ride.
In other words, it’s not about how long they can hodl, but how much control over themselves and the animal they can demonstrate.
For most riders, this endeavor ends in pain, even death – but for a select few, it ends in glory.
Those who find rhythm and harmony with the bull’s sways earn the highest scores and take home the prize money.
To the victor go the spoils.
And though trading is a psychological sport rather than a physical one, we too must avoid getting thrown off when the volatile bull starts to buck.
We also must find the same state of mental calm and rhythm when markets are whipping violently in order to profit and avoid ruin.
With that in mind, today let’s discuss a rare technical signal, which is telling us that Bitcoin is about to become a raging bull again for the first time since 2021.
But be prepared. While this signal has historically offered good fortune for savvy riders, it hasn’t come easy.
Like any good bull worth riding, there’ll be plenty of bucking involved.
So let’s saddle up…
The Golden Bucking Bull
If you’ve been following along with us in January, you likely remember “The King Is Dead, Long Live The King,” where I talked about the dollar’s “death cross.”
The death cross refers to a phenomenon which occurs when an asset’s 50-day moving average (MA) falls below its 200-day MA. It is the ultimate sign of bullish trend exhaustion.
If the “death cross” is the onset of winter, then the “golden cross” can be thought of as the first blooms of spring. It occurs when the 50-day MA rises above the 200-day MA.
As we’ll unpack below, every time this has happened to Bitcoin, it confirmed that a new macro bull trend is underway.
On this chart, the green line represents the 50-day MA, and the red the 200-day MA.
The 50-day ($19,820) has just surpassed the 200-day ($19,720), creating Bitcoin’s first “golden cross” since September 2021.

Historically, there are few signals more potent than the golden cross. As a positive leading indicator for Bitcoin, it has led to higher prices 100% of the time.
However, there is one caveat.
After each cross, we found that prices drop harshly in the near term, and the market suffers through a brutal shake-out period before it reaches new highs.
This shake-out period allows for cementing of the new trend before the arrival of a full-blown bull market.
Below, we see the most recent example of this from September 2021.
At that time, BTC was trading around $48,000 when the golden cross occurred. Just over a month later, it made an all-time high of $69,000.
But prior to that parabolic advance, it first had a minus-20% shake-out that sent it below $40,000.
Crucially, BTC’s 100-day MA (blue line) held on that retest, which enabled the subsequent move higher.
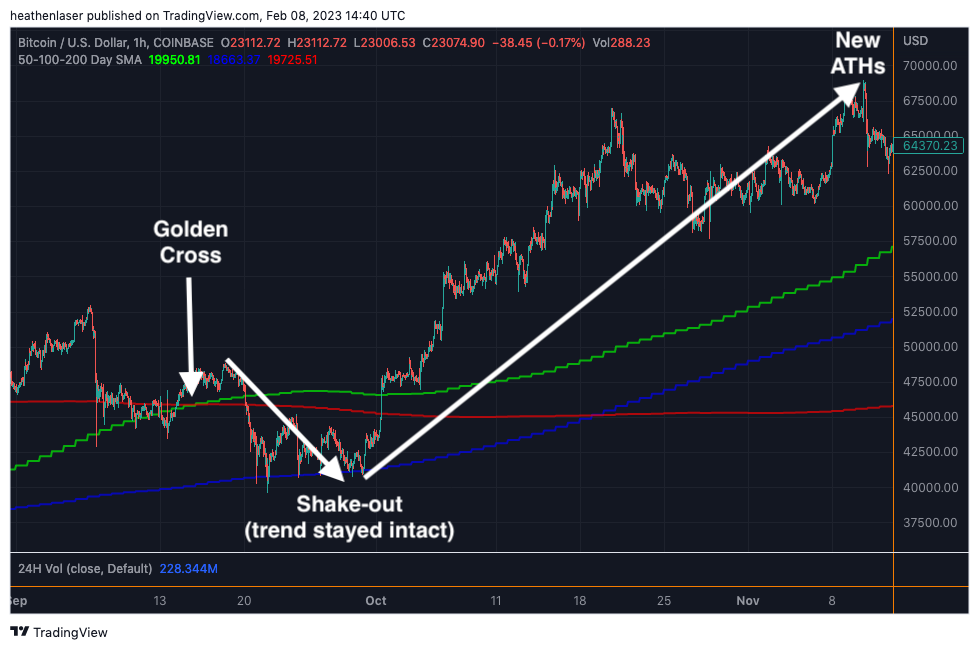
A bucking bull indeed.
The point of maximum opportunity came, not when the cross happened, but rather after the first major shake-out following the golden cross.
A common pattern we found while taking a look at BTC’s past golden crosses.
Ride ’em Cowboy
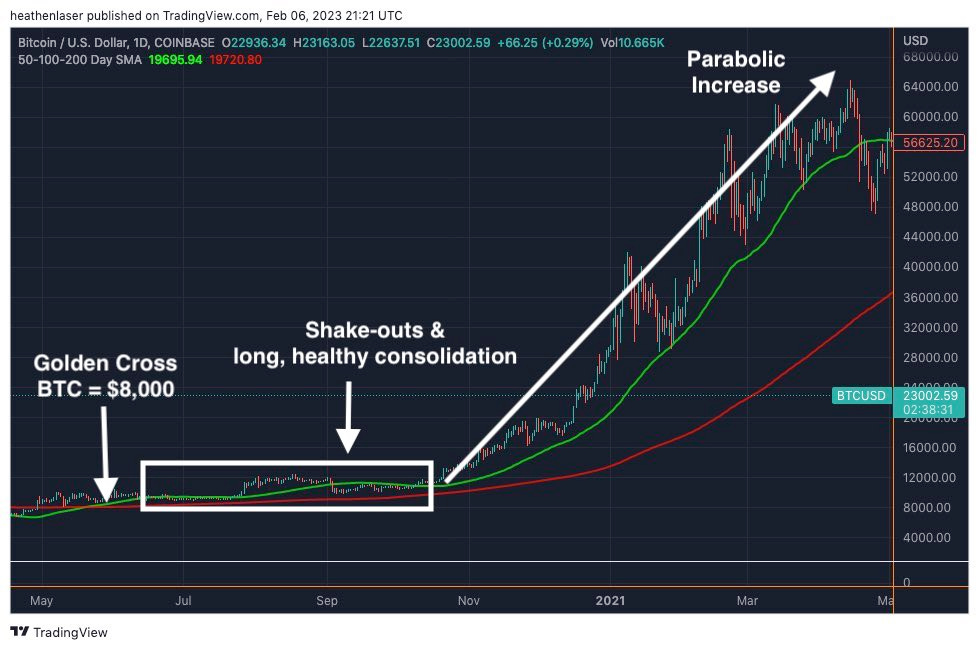
May 2020:
When Bitcoin’s golden cross printed at $8,000, price chopped around for over six months in a slow crawl.
Crucially, price stayed above the 200-day MA and never experienced a “death cross.” This resilience built the foundation for the late 2020–2021 cycle, when it peaked above $65,000.
Providing bull riders with maximum returns over 700%, or 8x, in less than a year.
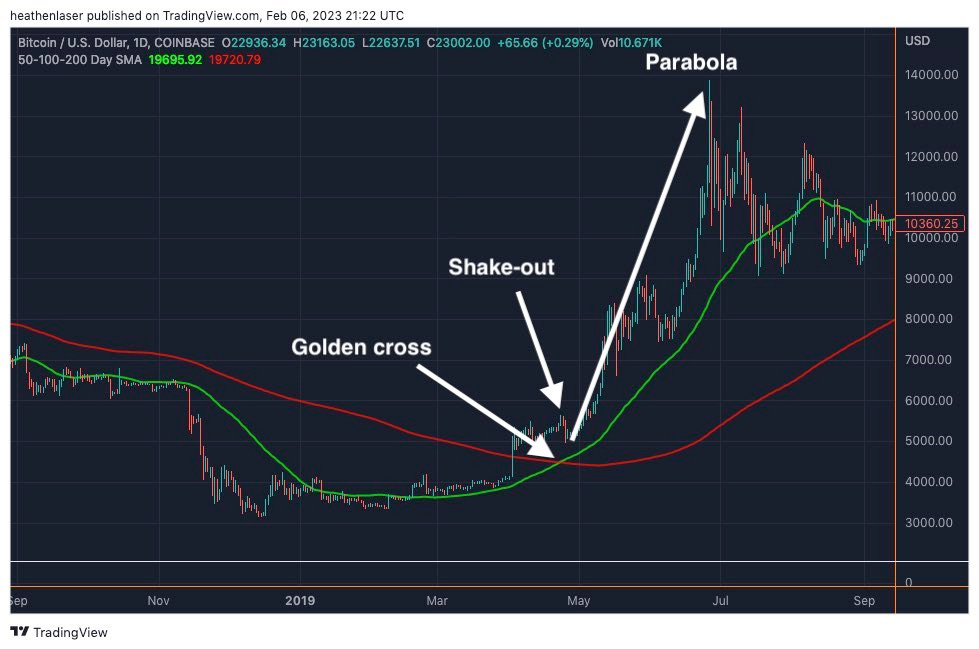
March 2019:
Very similar to our current market structure, Bitcoin rose from the depths of the bear market and experienced a golden cross at $6,000.
It then suffered an immediate drop of over 20%, before slingshotting back up to just under $14,000.
A maximum return of over 180%.
October 2015:
BTC’s golden cross hit around $300, then it immediately doubled to the $600 range, before dropping 50% and retesting the breakout shortly after.
That successful retest led to an even larger parabolic advance in the months that followed.
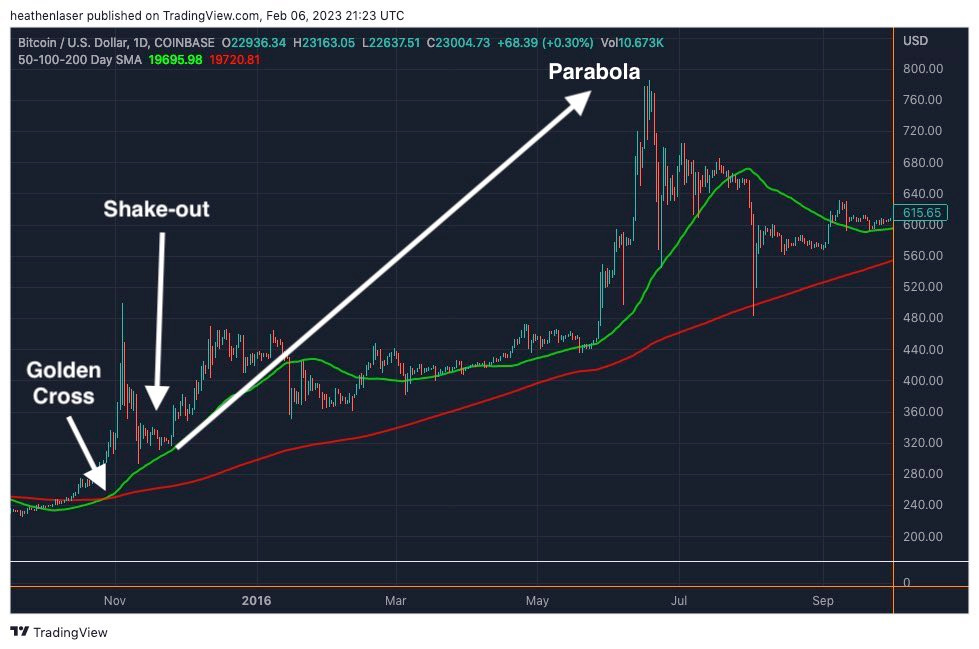
BTC ended up maintaining this bullish structure all the way through the 2017 bull market when it topped out above $19,500.
Providing a maximum return of 6,400%, or 65x, in just a few years’ time.
“Trend is your friend,” indeed.
But despite the golden cross’s perfect track record in predicting trend changes, we always look for more than one indicator to confirm what we’re seeing.
The good news is, there are some other confluent factors that are pointing in the same direction.
Zombie Dollar
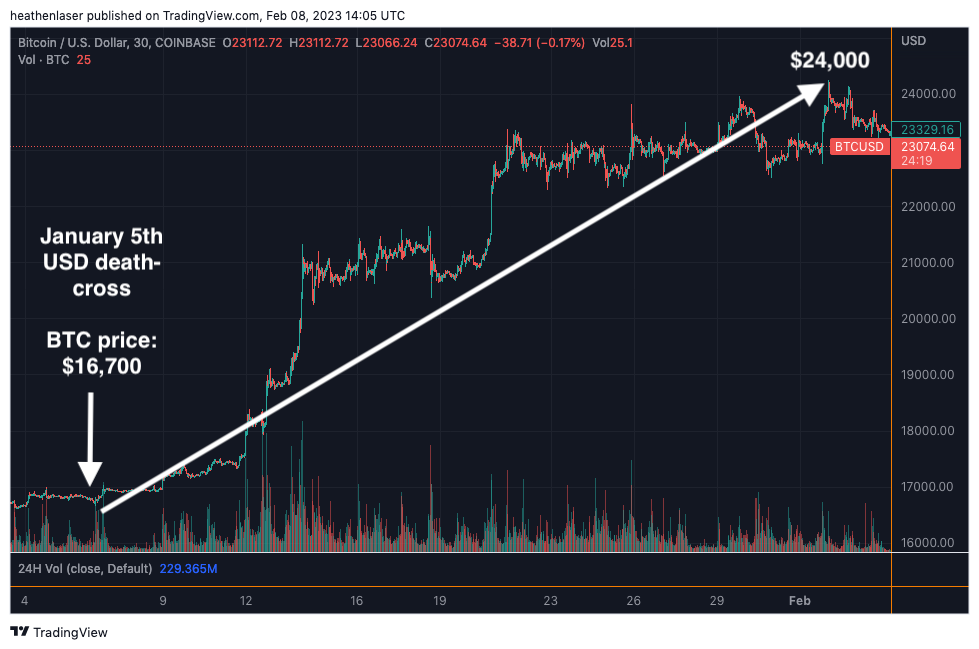
As we discussed back in early January, the U.S. Dollar Index (DXY) has been in a firm downtrend since Q4 2022. This was confirmed when the dollar hit a death cross on January 5.
And since the dollar has an inverse correlation to crypto, I said the former’s downtrend could open the gates for an early 2023 crypto rally.
In the weeks that followed, my hypothesis was confirmed. January saw DXY plummet to 100.80, a drop of over 12% from its September 2022 high of 114.80.
Meanwhile, BTC skyrocketed from the $16,000 range in early January to over $24,000 by month’s end.
I love it when a plan comes together.
But as you’ll notice in the below chart, DXY is now attempting to rise out of its grave.
It’s in the process of back-testing its lost major moving averages (green line = 50-day MA, blue line = 100-day MA, red line = 200-day MA).
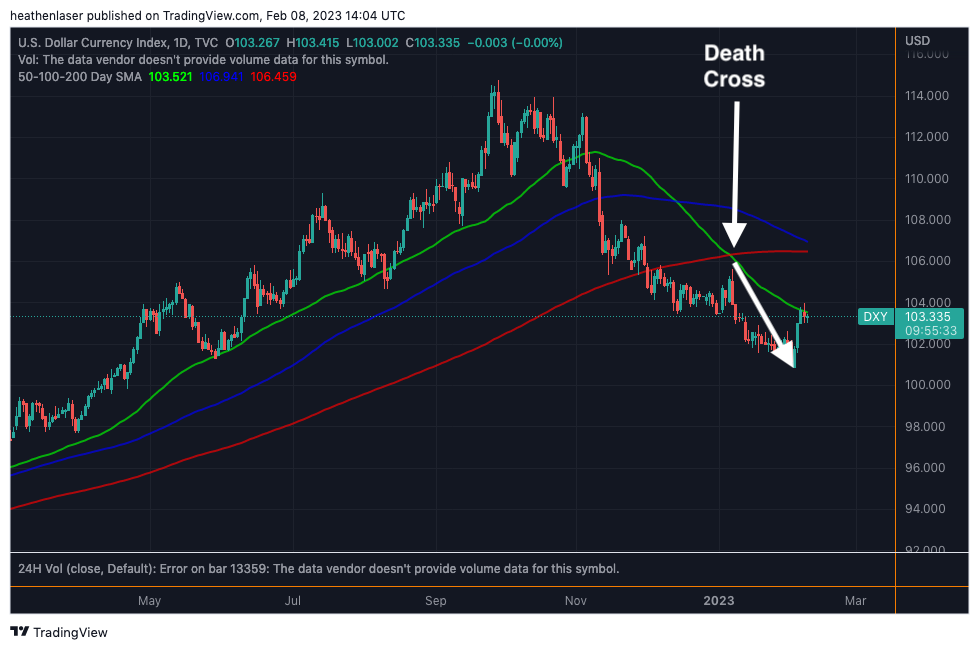
This DXY back-test is giving confluence to the idea that the bull market ahead may require a strong shake-out or two before going full throttle.
How DXY fares after retesting the 50-, 100-, and 200-day MAs in the weeks to come will provide us much insight into the market’s next move…
If it breaks through and holds above its 200-day MA (currently at ~106.45), asset markets will indeed become bearish again, and we could expect November’s lows to be threatened.
However, should this DXY back-test fail, either now (at the 50-day) or later, we can take it as confirmation that we have entered into a new macro environment.
One where the strong dollar that terrorized us in 2022 is now a neutered beast.
While we await confirmation, there are other metrics suggesting that both increased volatility and increased gains still lie ahead.
Final Round-Up
As we discussed a couple weeks back while analyzing the importance of ETH’s $1,700 level, confluence is key.
Finding multiple metrics all pointing in the same direction is what’s needed to steelman any thesis.
Thankfully, our database (which you too can access at TARA-NFT.com) is capable of providing just that.
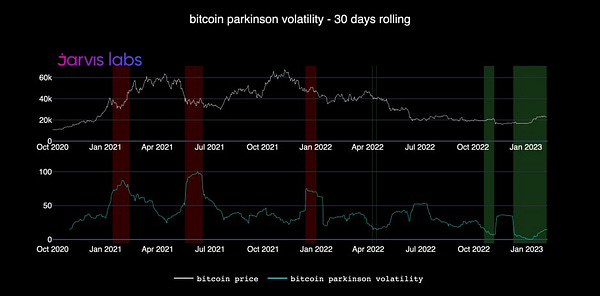
Below, we see the Parkinson volatility score. It measures the rate of price change over time. When it flashes red bars, that indicates price is likely to slow down and consolidate for a bit. When it flashes green, extreme price movement is likely.
Despite January’s 40%-plus run, the score remains at historically low levels.

Very interesting that for all of the #Bitcoin mania in January its Parkinson Volatility score hardly moved I think we can safely expect and prepare for a breakout of volatility before q1 is up For a refresher on this indicator check out below open.substack.com/pub/jarvislabs…

JJ the Janitor@JLabsJanitor
Happy new year! A new all time low in #Bitcoin Parkinson Volatility score shown below Even lower than it was in the days prior to FTX's collapse Expect this to jump alongside a decisive move out of the November-present price range in the near future👀 https://t.co/tQ7ieNxdLU
This syncs with our “bucking bull” theory that there will be additional upside, but also more volatility in the time to come.
Additionally, we’ve seen the return of large whale wallets on our divergence charts (as indicated by the red dots below, white arrow on the right), which signals big money movers have been accumulating to start 2023.
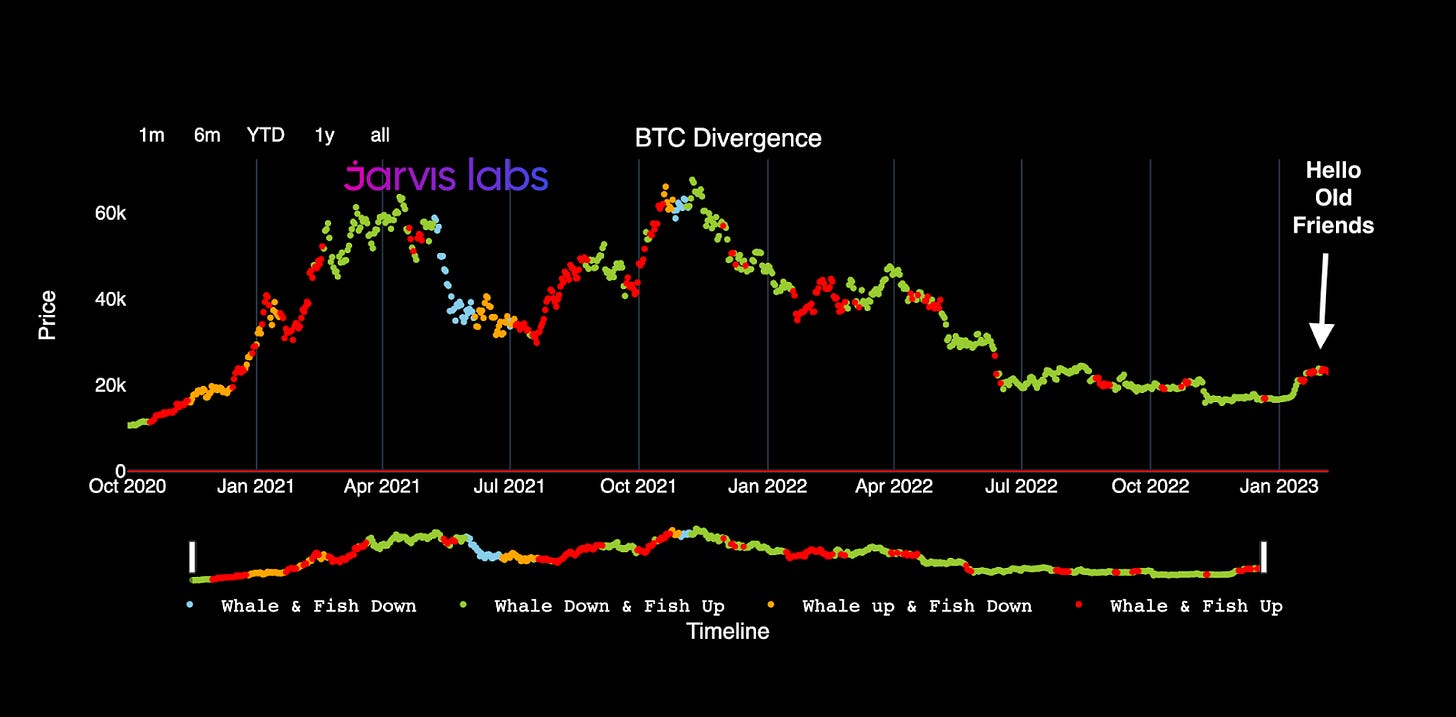
Alone, this doesn’t mean much. But when we add it to the ongoing confluence of bullishness we’ve seen across the board from technicals and on-chain to fundamentals and macro, it is a very encouraging sign that we’re closer to the beginning of this rally rather than the end.
Your only job now is to manage risk and ensure you don’t get bucked off during the next shake-out.
Watch your leverage, avoid giving into emotional reactions at the extreme edges of trading ranges, and sync yourself with the market’s rhythm.
To reiterate what I mentioned at the end of last week’s essay on open interest, practicing patience will turn these inevitable shake-outs into opportunities if you know your key levels and plan for them in advance.
That’s all for me today. Happy trails to you, and until next time my fellow desperados…
Roll me over and set me free
The cowboy’s life is the life for me
Your friend,
JJ